 View figure.
This chapter describes the pedb debugger. The pedb debugger provides a simplified, Motif graphical point-and-click interface. pedb is designed to debug parallel C or Fortran applications. The pedb debugger is a poe application with some modifications on the home node to provide a user interface. This means that most of the setup for the debugger is identical to the setup for poe.
pedb can be used to debug an application either by starting the application under the control of the debugger, or by attaching to an already running poe application.
If starting the application under the control of the debugger, it is first necessary to compile the program and set the execution environment. See IBM Parallel Environment for AIX: Operation and Use, Volume 1, Using the Parallel Operating Environment for more information on the following:
If using pedb to attach to an application, much of the setup described above is not necessary since the application is already running. However, it is still highly desirable, but not absolutely necessary, to have the application compiled with the -g option. When pedb attaches to an application that is not compiled with -g, the debug information is limited to a stack trace.
As you read these steps, keep in mind that pedb accepts almost all the option flags that poe accepts, and responds to almost all of the same environment variables.
This release of pedb does not support the debugging of applications that were compiled with previous releases of poe.
You can start the pedb debugger in either normal mode or attach mode. In normal mode your program runs under the control of the debugger. In attach mode you attach to a program that is already running. Certain options and functions are only available in one of the two modes. Since pedb is a source code debugger, some files need to be compiled with the -g option so that the compiler provides debug symbols, source line numbers, and data type information. When the application is started using pedb, debugger control of the application is given to the user by default at the first executable source line within the main routine. This is function main in C code or the the routine defined by the program statement in Fortran. In Fortran, if there is no program statement, the program name defaults to main. If the file containing the main routine is not compiled with -g the debugger will exit. The environment variable MP_DEBUG_INITIAL_STOP can be set before starting the debugger to manually set an alternate file name and source line where the user initially receives debugger control of the application. Refer to the appendix on POE environment variables and command-line flags in IBM Parallel Environment for AIX: Operation and Use, Volume 1, Using the Parallel Operating Environment
The way you start the debugger in normal mode depends on whether the program(s) you are debugging follow the SPMD or MPMD model of parallel programming. In the SPMD model, the same program runs on each of the nodes in your partition. In the MPMD model, different programs can run on the nodes of your partition.
If you are debugging an SPMD program, you can enter its name on the pedb command line. It will be loaded on all the nodes of your partition automatically. If you are debugging an MPMD program, you will load the tasks of your partition after the debugger is started.
* This starts pedb. You will see the pedb main window open. If you specified a program, it is loaded on each node of your partition and you see the message:
0030-0101 Partition loaded.
* This starts pedb in attach mode. See "Attach Mode" for more information.
* This writes the pedb usage to STDERR. It includes pedb command line syntax and a description of pedb options.
The options you specify with the pedb command can be program options, POE options, or pedb options listed in Table 4. Program options are those that your application program will understand. You can also specify certain X-Windows options with the pedb command.
For the most part, you can use the same command-line flags on the
pedb command as you use when invoking a parallel program using the
poe command. For example, you can override the
MP_PROCS variable by specifying the number of processes with the
-procs flag. Or you could use the -hostfile flag
to specify the name of a host list file. For more information on the
POE command-line flags, see IBM Parallel Environment for AIX:
Operation and Use, Volume 1, Using the Parallel Operating Environment
Table 4. Debugger Option Flags (pedb)
| Use this flag: | To: | For example: |
|---|---|---|
| -a | Attach to a running poe job by specifying its process id. This must be executed from the node where the poe job was initiated. When using the debugger in attach mode there are some debugger command line arguments that should not be used. In general, any arguments that control how the partition is set up or specify application names and arguments should not be used. | To start pedb in attach mode:
|
| -d | Set the limit for the nesting of program blocks. The default nesting depth limit is 25. | To specify a nesting depth limit:
|
| -h | Write the pedb usage to STDERR then exit. This includes pedb command line syntax and a description of pedb flags. | To write the pedb usage to STDERR:
|
| -I
(upper case i) | Specify a directory to be searched for an executable's source files. This flag must be specified multiple times to set multiple paths. (Once pedb is running, this list can also be updated using the Update Source Path window.) | To add directory1 to the list of directories to be searched
when starting the pedb debugger:
You can add as many directories as you like to the directory list in this way. For example, to add two directories:
|
| -x | Prevents stripping _ (trailing underscore ) characters from symbols originating in Fortran source code. This enables distinguishing between symbols which are identical except for an underscore character, such as xxx and xxx_. | To prevent trailing underscores from being stripped from symbols in
Fortran source code:
|
The pedb debugger provides an attach feature, which allows you to attach the debugger to a parallel application that is currently executing. This feature is typically used to debug large, long running, or apparently "hung" applications. The debugger attaches to any subset of tasks without restarting the executing parallel program.
Parallel applications run on the partition managed by poe. For attach mode, you must specify the appropriate process identifier (PID) of the poe job, so the debugger can attach to the correct application processes contained in that particular job. To get the PID of the poe job, enter the following command on the node where poe was started:
$ ps -ef | grep poe
You initiate attach mode by invoking pedb with the -a flag and the PID of the appropriate poe process:
$ pedb -a <poe PID>
For example, if the process id of the poe is 12345 then the command would be:
$ pedb -a 12345
pedb starts by showing a list of task numbers that comprise the parallel job. The debugger obtains this information by reading a configuration file created by poe when it begins a job step. At this point you must choose a subset of that list to attach the debugger. Once you make a selection and the attach debug session starts, you cannot make additions or deletions to the set of tasks attached to. It is possible to attach a different set of tasks by detaching the debugger and attaching again, then selecting a different set of tasks.
| Note: | The debugger supports up to 32 nodes. When attaching to jobs larger than 32 nodes, it is suggested you select a subset of tasks less than or equal to 32. |
The debugger attaches to the specified tasks. The executable is stopped wherever its program counter happens to be, and is then under the control of the debugger. The other tasks in the original poe application continue to run. pedb displays information about the attached tasks using the task numbering of the original poe application partition.
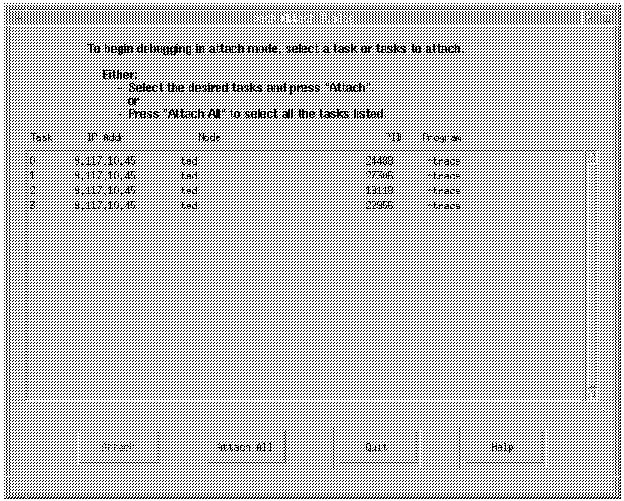
Figure 3 shows the pedb. Attach window.
Figure 3. pedb Attach window
View figure.
The pedb Attach window contains a list of tasks and, for each task, the following information:
At the bottom of the window there are four buttons:
At this point you can select a set of tasks to which the debugger attaches:
* The window closes and the pedb Main Window appears.
Task buttons appear for each task selected for debugging. Once the debugger attaches to the selected tasks, the buttons change from a label of "UA" (unattached) to "D" (debug state), and from the default color of "wheat" to "green".
The default group button is labelled "Attached" and consists of all the tasks chosen for attach.
When starting the debugger in attach mode, the default context is "Attached", as indicated at the top of the main window:
pedb: View - 1, Context - Group Attached
pedb provides substantial information when debugging an executable compiled with the -g option. However, you may find it useful to attach to an application not compiled with -g. pedb allows you to attach to an application not compiled with -g, however, the information provided is limited to a stack trace.
You can also attach pedb to an application compiled with both the -g and optimization flags. However, the optimized code can cause some confusion when debugging. For example, when stepping through code, you may notice the line marker points to different source lines than you would expect. The optimization causes this re-mapping of instructions to line numbers.
You should not use certain command line arguments when debugging in attach mode. If you do the debugger will not start, and you will receive a message saying the debugger will not start. In general, do not use any arguments that control how the debugger partition is set up or that specify application names and arguments. You do not need information about the application, since it is already running and the debugger uses the PID of the poe process to attach. Other information the debugger needs to set up its own partition, such as node names and PIDs, comes from the configuration file and the set of tasks you select. See Appendix B. "Command Line Flags for Normal or Attach Mode" for a list of command line flags showing which ones are valid in normal and in attach debugging mode.
The information in the appendix is also true for the corresponding environment variables, however pedb ignores the invalid setting. The debugger displays a message containing a list of the variables it ignores, and continues.
For example, if you had MP_PROCS set, when the debugger starts in attach mode it ignores the setting. It displays a message saying it ignored MP_PROCS, and continues initializing the debug session.
As mentioned previously, you have the option of specifying the name of your application when you invoke pedb which causes it to be loaded on all the tasks automatically. This method is generally used to debug SPMD codes. If you need to load an MPMD code, or prefer to use the file selection window to load your partition you should not specify your application name on the pedb command line.
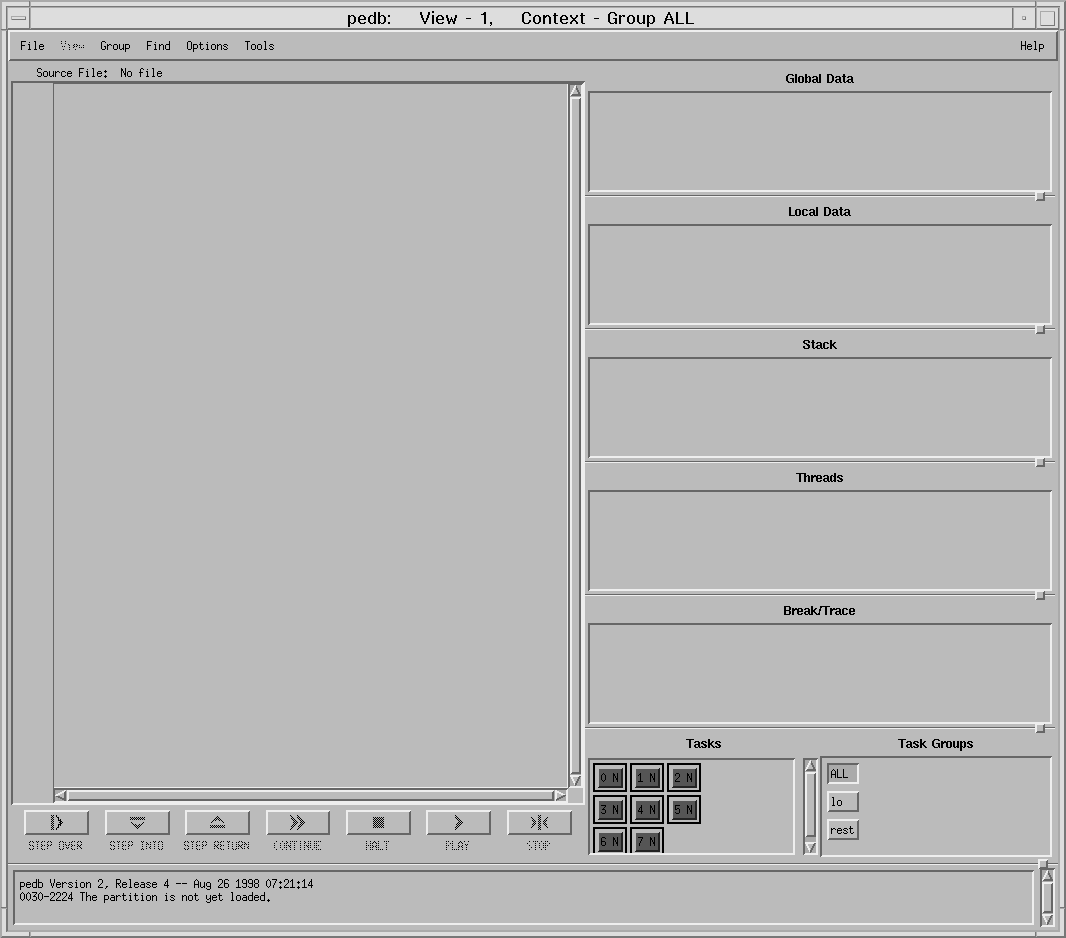
The initial pedb window you see will have blank areas as illustrated in Figure 4. If you specified an application name on the command line, the debugger will continue, by loading your application for each task which will fill in the main window as illustrated in Figure 6.
Following is a brief overview of the pedb main window layout.
Figure 4. pedb main window before the partition is loaded
 View figure.
If you didn't do an SPMD load from the pedb command line, the initial screen opens with many options unavailable. For example, the View option and control buttons are inactive. These options will become available after all the tasks have been loaded.
During this initial loading phase, you can:
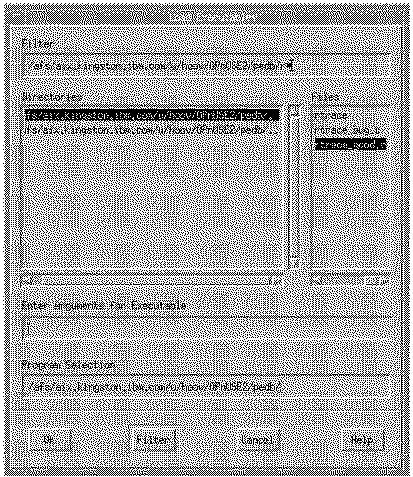
If you did not specify a program to load on the pedb command line, you will use the Load Executables window. In this case, a partition has been created to support the number of tasks that were defined for the application. In general, the term task refers to an individual program that is part of a parallel application. The number of tasks was determined by the value of the MP_PROCS environment variable, or the value specified by the -procs flag, if entered on the command line when invoking pedb.
A partition may be thought of as a system of one or more physical processor nodes, along with the infrastructure necessary to execute a parallel application. When you load a partition, you provide programs for the infrastructure to run.
When you specify a program to run by invoking pedb with a program name on the command line, it assumes an SPMD model and automatically loads all tasks with this program. With the Load Executables window however, you also have the ability to load different executables on different tasks or groups of tasks (as in the case of an MPMD application), or to load the same executable on all tasks in the instance when the file is not located in a shared file system or in the same directory on all tasks. You can load programs one task at a time by selecting a different button in the Tasks area before opening the Load Executables window. You can also load a subset of all the tasks at one time by first creating the desired task group(s), and then selecting the corresponding group button in the Task Groups area before using the Load Executables window.
Like POE, pedb uses the normal shell search path that is established by the environment variable PATH if you don't explicitly give a path. pedb checks this path and loads the first occurrence of the program you specify (scanning from left to right) for each task. The mechanism for finding source files is different from this. See "Source Code Search Path" for information on the source code search path.
Figure 5. Load Executables window
 View figure.
| To load the same executable for all tasks (SPMD): | To load different executables (MPMD): |
|---|---|
To set the context on all tasks:
Once the context is set on all tasks:
| Set the context before loading each program. For example, suppose
there will be five tasks numbered 0 through 4. To load a program for
task 0 and a program for tasks 1 through 4, you would:
Create a group, say group1, containing tasks 1 through 4.
|
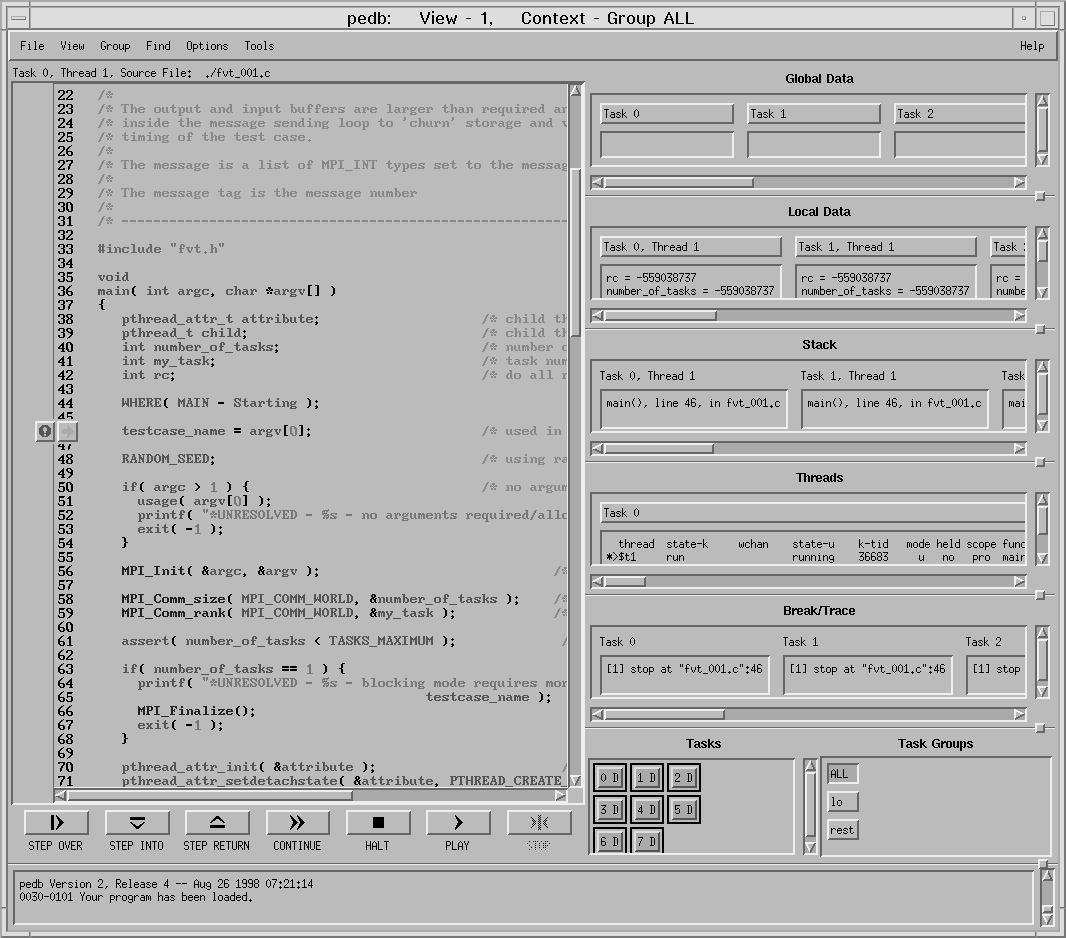
Once the partition is loaded, the pedb window will make all of its options available.
Figure 6. pedb main window after partition is loaded
 View figure.
This window consists of:
In pedb, context is defined as a task or group of tasks to which the debugger directs certain actions or requests. The context sensitive controls, directly below the Source Area (lower-left), only affect those tasks in the current context. The context also determines which task's variables and stack traces will be displayed.
When you start a pedb session, the context is initially set to all tasks. As illustrated in Figure 4, the title bar of the pedb window reads
pedb: View - 1, Context - Group ALL.
If you want the current context to be something other than all tasks, you can use the push buttons in the Task and Task Groups areas to change it. Press the button that corresponds to the task or group of tasks you wish to include in the current context. Note that you can select only one task or task group at a time.
For example, assume you have a parallel program that is divided into five tasks. The tasks are numbered 0 through 4, and each has a task push button in the Task area. To set the context to just task 1:
* The pedb debugger sets the context to task 1. To illustrate this, the debugger highlights the task's push button and updates the title bar of the pedb window to read pedb: View - 1, Context - 1.
You can also define the current context by specifying groups of tasks. When you start a pedb session, a task group is automatically defined that consists of all tasks. This task group is named ALL. See "Creating Task Groups" for information on how to create task groups.
To set the command context back to the task group ALL:
* The pedb debugger sets the context to all tasks. To illustrate this, the debugger highlights the ALL task group push button, as well as the other task push buttons, and updates the title bar of the pedb window to read pedb: View - 1, Context - ALL.
You can change the context at any time during the debugging session.
In general, the term task refers to an individual program that is part of a parallel application.
You can collect a number of tasks under a common group name. When you do this, the debugger creates a push button for the task group in the Task Groups area. You can then set the context to include the tasks in the group by pressing its push button.
To understand why you would want to define your own task groups, consider the following example. You are debugging a master/worker program containing many blocking sends and receives. The program has ten tasks. Task 0 is the master task, and tasks 1 through 9 are the workers. During debugging you might start off by running the master until a blocking receive operation cannot complete. Then you could set the context on all the workers and run them past the matching send. This will allow the master task to proceed. Then set the context back on the master and run it some more.
Since you plan to keep switching the context back and forth between the master and workers, you might find it helpful to group tasks 1 through 9 into a task group named workers. Then you would be able to press a task group button to set the context on the workers only.
You could also create a group named master containing just task 0. Although the "group" in this case has only one task, the name master is more meaningful than a task number and is therefore easier to remember.
Provide a group name that is no longer than 32 characters which starts with an alphabetic character, and is followed by any alphanumeric character combination.
You can create a group at any time during the debugging session using the Add Group window.
To create a task group:
* The Add Group window opens.
Figure 7. Add Group window
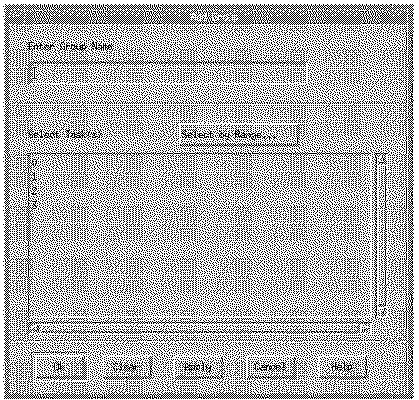 View figure.
a task by placing the cursor over a task number and depressing the left mouse button.
or
a range of tasks by depressing the left mouse button over the first task, and dragging it over the range of tasks to be included in the group.
or
a set of nonconsecutive tasks by selecting the first task, and while holding down the control key, selecting the next task(s). Note that selecting a previously selected variable will de-select it.
* Apply creates the task group. A button containing the name of the group appears in the Task Groups area of the main window. The Add Group window remains open for further selections. OK creates the group, as above, and closes the Add Group window.
Clear removes all task selections and clears the text in the group name field.
Cancel closes the Add Group window.
The Select By Range feature is useful when you need to select a large range of tasks. To indicate the tasks using the Select By Range button:
* The Select By Range window opens.
For example:
| To add: | Type in: |
|---|---|
| task 6 and 8 | 6,8 |
| tasks 6 and 8 | 6 8 |
| 6 through 8, and 75 | 6:8 75 |
| 6 through 8, and 75 | 6-8 75 |
* Apply adds the selected tasks to the Add Group window and leaves the Select By Range window open for other selections.
OK adds the tasks to the Add Group window and closes the Select By Range window.
Cancel closes the Select By Range window.
If a particular task group no longer seems necessary, you can delete it using the Delete Group window. You may delete a group (except "all" or "attached") at any time during the debugging session.
To delete a task group:
* The Delete Group window opens.
* The group name highlights to show that you have selected it.
or
OK
* Apply deletes the group and removes the group button from the Task Groups area. The Delete Group window remains open. OK deletes the group, as above, and closes the Delete Group window.
Cancel closes the Delete Group window.
The task buttons used to change pedb context also display information about the status of each task. During your debug session, the color and the code letter change during different activities. For example, during the load process, the color will change from red to yellow to green and the status code letter will change from N to L to D.
| Note: | These are the default colors, but you can configure them by updating your .Xdefaults file. |
Since each task runs independently of pedb, the debugger
maintains status information for each task in the partition. The
following table shows the status codes that are displayed in each task button
and describes their meanings.
| Code | Default Color | Status | Description |
|---|---|---|---|
| N | Red | Not loaded | The task has not yet been loaded with an executable. |
| L | Yellow | Loaded | The task has been loaded with an executable. |
| D | Green | Debug Ready | The task is stopped and can be debugged using pedb. |
| R | White | Running | The task is in control and running. |
| P | MediumSeaGreen | Playing | The Play button has been depressed. The task is switching between Playing and Running, with some limited function. |
| x | Khaki | Exit Requested | The task in the parallel application has issued exit or returned from main, and is thus waiting in the POE specific exit code for its peer tasks to indicate that they too are waiting to exit. |
| X | Goldenrod | Exited | The task has reached the hidden_exit breakpoint that was set by libdbx. |
| E | Orange | Error | The task is in an unknown state. |
| U | LightSteelBlue | Unhooked | The task has been unhooked. |
| UA | Wheat | Unattached | The task has not yet been attached. |
The pedb debugger lets you control execution by setting breakpoints in, or else by stepping through, the source code. This section describes how to perform these familiar debugging tasks using the pedb debugger. It also describes some additional functions pedb provides such as unhooking tasks so they can run without intervention from the debugger.
The simplest method of controlling program execution with pedb
is by manipulating the control buttons located directly below the Source Area
on the pedb window. From left to right, the control buttons
are Step Over, Step Into, Step Return, Continue, Halt, Play, and Stop.
| In order to: | Press this Control Button: | ||
|---|---|---|---|
| Manually step the execution of tasks in the current context, by a line of source code, stepping over subroutines and functions. | Step Over | ||
| Manually step the execution of tasks in the current context, by a line of source code, stepping into subroutines and functions. | Step Into | ||
| Return from the current function to the function which called it. This typically reduces the call stack by one function. | Step Return | ||
| Continue executing the tasks in the current context up to the next breakpoint or to the program's completion. | Continue | ||
| Interrupt execution of running tasks. The Halt button is used for situations in which a process is in a running state, such as blocked, and must be interrupted. | Halt | ||
| Have the debugger repeatedly execute the tasks. Available Play choices are Step Over, Step Into, and Continue. | Play | ||
| Break out of Play mode (as tasks finish, they will stop) | Stop | ||
| |||
Every time execution of a task in the current context stops, the debugger updates the pedb window to display the current information. In the Source Area, the debugger uses a line marker to identify the line of code at which execution has stopped. The debugger draws a line marker as an arrow pointing at the line of code. For example, when you first load a parallel program onto the partition, it runs up to the first executable statement and stops. In Fortran and C programs, this is the first executable source line defined by the user, so the debugger draws a line marker there. Since you can set the context on a subset of tasks and run them independently of the others, you can have a number of line markers displayed. When more than one task is at the same line of code, the line marker appears as a button.
If you are unsure of the task(s) associated with a particular line marker:
* A label appears identifying the tasks and threads at that line of code. For threaded programs, each task number is followed by the displayed thread number, which is the thread whose source file, local variables, and stack are displayed. The label is visible only while you hold the mouse button down.
Line markers may be thought of as ad hoc groups which can be used to manipulate the parallel application. This manipulation is independent of the current context. For example, say you are debugging a parallel program with three tasks numbered 0, 1, and 2. Tasks 0 and 1 are at line 22, while task two is at line 24. You want to step tasks 0 and 1 to the same line as task two. To step tasks 0 and 1 as if they were in a group:
* A menu appears containing four items - Step Over, Step Into, Step Return, and Continue. These menu items correspond to the Step Over, Step Into, Step Return, and Continue pedb control buttons.
The debugger runs tasks 0 and 1 one line and stops them at line 23.
The line marker, as used above, allows you to perform simple operations on single or multiple tasks that are not in a predefined task group. If tasks 0 and 1 comprised a group, you could change the context to that group, and then use the control buttons as above, then restore the original context.
| Note: | For more information on stepping, see "Stepping Execution". |
Each task can contain multiple threads. The threads for the tasks are listed in the threads pane on the right hand side of the pedb main window just below the stack pane. The list of threads for a single task can also be displayed in a separate window known as the Threads Viewer window.
When a task is in "debug ready" state, the interrupted thread is defined as the thread that stopped due to encountering a breakpoint or a signal. When this thread stopped, it in turn stopped all of the other threads in the process. The interrupted thread is treated specially by single step execution control. Subsequent step execution control that is issued will have the effect of stepping the interrupted thread while letting all other threads continue. It is not possible to change the interrupted thread to another thread. The interrupted thread is denoted by an asterisk at the start of the threads row.
Initially, when a task reaches "debug ready" state, the displayed thread is the same as the interrupted thread. The displayed thread for a task is alterable by the user. When changed to another thread, the stack, local variables, source line arrow, and the source file will be updated to reflect those for the new displayed thread. The displayed thread is denoted by a "greater than" (>) operator at the start of the threads row.
The pedb debugger lets you set stopping places, called breakpoints, in your program. You mark which lines are to be breakpoints for the tasks in the current context and then run the program using the Continue button. When the tasks reach a breakpoint, execution stops and you can then examine the state of the program.
In threaded programs, setting a breakpoint on a task, sets the breakpoint for all threads in the task. When any thread in a task hits a breakpoint, all other threads in the task are also stopped.
| Note: | The Play button will not stop execution at breakpoints, so it is suggested that you use the Continue button. |
To set a breakpoint:
* The line highlights to show that you have selected it.
* A selection menu appears.
* The debugger sets, for each task in the current context, a breakpoint at the marked line of code.
| Note: | You can also set a breakpoint by double clicking the left mouse button after placing the cursor over an executable source line. |
In the Source Area, the debugger places a stop marker (drawn to look like a stop sign containing an exclamation point) next to the line with the breakpoint.
In addition to the stop marker, the debugger displays a breakpoint event message (one for each of the tasks in the current context) in the Break/Trace area. The message includes an interpretation of the breakpoint. For example:
[1] stop at "ptst4.f":22
| Note: | The debugger sets a separate breakpoint for each task in the context. |
You can also specify a condition when setting a breakpoint. The task then stops executing at the breakpoint only if the condition evaluates to true.
You can specify conditions with a subset of C syntax, with some Fortran extensions. The following operators are valid:
Arithmetic Operators
Relational and Logical Operators
Bitwise Operators
Data Access and Size Operators
Miscellaneous Operators
To set a conditional breakpoint:
* The line highlights to show that you have selected it.
* A selection menu appears.
* The debugger displays the Conditional Breakpoint window.
* The debugger closes the Conditional Breakpoint window and sets a breakpoint for the tasks in the current context.
As with regular breakpoints, the debugger places a stop marker next to the line with the breakpoint in the Source Area. In the Break/Trace area, it adds a message reporting the conditional breakpoint the debugger has built for each of the tasks in the current context. For example:
[1] if x > 19 { stop } at "ptst4.f":22
Thread specific conditions can be added to breakpoints and tracepoints using the conditional breakpoint and conditional tracepoint windows. You set the conditions using the variable $running_thread. This variable represents the thread that encountered the breakpoint first. This thread (the interrupted thread) will cause all of the other threads to stop. For example, adding the condition $running_thread == 1 after selecting line 234 in your source would result in the program stopping when the thread labeled $t1 encountered line 234. To state this another way, the breakpoint is triggered only when thread 1 encounters the breakpoint. Refer to IBM AIX Version 4 General Programming Concepts: Writing and Debugging Programs for more details.
When you set a breakpoint by following the previous instructions, remember that a separate breakpoint is set for each of the tasks in the current context. If you wish to see a list of the task(s) associated with a particular stop marker in the Source Area:
* A label appears identifying the tasks with a breakpoint at that line of code. The label is visible only while you hold the mouse button down.
When multiple breakpoints are set for a given task, the breakpoint will appear multiple times in the Break/Trace area. The corresponding breakpoint events will also be highlighted in the Break/Trace Area. This graphically shows the breakpoints that would be deleted if you used the procedure for removing all breakpoints at the same line of code, described in Table 7.
Any number of the active tasks may have one or more breakpoints at that same line of code. You can remove:
or
The following table shows how to remove breakpoints.
| To remove the breakpoint for a single task: | To remove all breakpoints at the same line of code: | ||
|---|---|---|---|
|
|
The pedb debugger lets you single-step execution of your program. In other words, you can run the tasks in the current context one source code line at a time. For threaded programs, single step execution has the effect of single stepping the interrupted thread, while letting all other non-held threads in the task continue freely without stopping at any breakpoints. All threads will again be stopped when the stepping thread reaches the appropriate source line. You can manually control each step, or have the debugger repeatedly step through the tasks in the current context at a selected interval. There are three methods of stepping the execution of your program. You can use the Step Over button to step over the subroutines and functions of your program. The Step Into button lets you step into the subroutines and functions of your program. Also, the Step Return button lets you return to the calling function.
To step execution, stepping over subroutines and functions:
* The debugger runs one line of the source code for the tasks in the current context and stops.
The function of the Step Over Control Button is to:
To step execution, stepping into subroutines and functions:
* The debugger runs one line of the source code for the tasks in the current context and stops.
The function of the Step Into Control Button is to:
The debugger changes the source code displayed in the Source Area to that of the called function, and adds the function call to the Stack Area.
To step execution, returning to the calling function:
* The debugger returns to the calling function and stops.
The function of the Step Return Control Button is to:
To automatically repeat execution:
* The debugger repeatedly steps execution of the tasks in the current context.
When using the Play Control Button, execution continues for the tasks in the current context until you press the Stop Control Button. The Play function allows you to execute multiple iterations of Step Over, Step Into or Continue (see "Customizing the Play Control Button" for more information). It updates the pedb window for each play cycle executed.
The Continue function of the Play Control Button can be particularly valuable when looking at loop processing. A break point may be set within a loop and the application data will be updated for each loop iteration.
Since the debugger has to keep updating the pedb window when in play mode, this is a slower form of execution than using the Continue Control Button. The advantage is that it provides you with more intermediate information.
For example, say you are debugging a master/worker program containing many blocking sends and receives. The context is on the worker tasks. You set a breakpoint and then press the Continue Control Button to continue execution of the worker tasks. Before reaching the breakpoint, however, the tasks hit a blocking receive intended to synchronize execution between the workers and the master task. Because the master is not in the current context, the receive operation cannot complete and so the workers cannot reach the breakpoint. Since the debugger cannot refresh the pedb window until the pending Continue function completes, the problem is not immediately observable. However, if you were repeatedly stepping the tasks using the Play function, you would see the line marker and other application information in effect just prior to the pending Step. You would see the task buttons holding in the running state and have a clear indication of where the program is hung.
To stop execution (stop playing):
* The debugger stops executing the program's tasks.
To interrupt execution (interrupt a waiting process):
* The debugger interrupts execution and returns control to the user.
When you press the Play Control Button, by default it repeatedly executes Step Into(s), with one-second between each Step Into. However, you can customize the Play Control Button to:
You can set these options from the main menu, using the Options pulldown.
To specify the command:
* Another menu appears with the command choices.
* The menu closes, and the Play Control Button is set to execute the command you specified.
To specify the delay between command iterations:
* The Change Play Delay window opens.
* The Change Play Delay window closes, and the Play Control Button is set to execute its command with the new delay you specified.
You can also set these options from the pop-up menu on the Play Control
Button:
| To specify the command: | To specify the delay between command iterations: |
|---|---|
|
|
The pedb debugger lets you set tracepoints in your program. When tasks reach a tracepoint during execution, the debugger writes information regarding the state of the program to the window from which pedb was invoked.
For threaded programs, tracepoints are set for all threads in the task by default. Each time a thread in the task encounters the tracepoint, a trace record is written.
Tracepoints can be set at any executable line of code within the program.
To set a tracepoint:
* The line highlights to show that it is selected.
* The Break/Trace menu appears.
* The debugger sets a tracepoint at the selected line for the tasks in the current context.
In the Source Area, the debugger places a blue trace marker next to the line with the tracepoint. The trace marker is drawn as two eyes looking at the line of code.
In addition to the trace marker, the debugger displays a tracepoint event message (one for each of the tasks in the current context) in the Break/Trace area. The message includes an interpretation of the tracepoint preceded by the event ID associated with it. For example:
[6] trace at "mikia.f":15
| Note: | The debugger sets a separate tracepoint for each task in the context. |
You can also specify a condition when setting a tracepoint. The tasks then write trace information only if the condition evaluates to true. See "Specifying Conditions for Breakpoints and Tracepoints" for more information.
Thread specific tracepoints can be set in a similar fashion to thread specific breakpoints. See "Specifying Thread Specific Breakpoints and Tracepoints" for more information.
To set a conditional tracepoint:
* The line highlights to show that you have selected it.
* A selection menu appears.
* The debugger displays the Conditional Tracepoint window.
* The debugger closes the Conditional Tracepoint window and sets a tracepoint for the tasks in the current context.
As with regular tracepoints, the debugger places a trace marker next to the line with the tracepoint in the Source Area. In the Break/Trace area, it adds a message reporting the conditional tracepoint for each of the tasks in the current context. For example:
[7] trace at "blist.f":23 if x > 19
If you wish to see a list of the task(s) associated with a particular trace marker in the Source Area:
* A label appears identifying the tasks with a tracepoint at that line of code. The label is visible only while you hold the mouse button down.
When multiple tracepoints are set for a given task, the tracepoint will appear multiple times in the Break/Trace area. The corresponding breakpoint events will also be highlighted in the Break/Trace Area. This graphically shows the tracepoints that would be deleted if you used the procedure for removing all tracepoints at the same line of code, described in Table 8.
Any number of the active tasks may have a tracepoint at that same line of code. You can remove:
or
The following table shows how to remove tracepoints.
| To remove the tracepoint for a single task: | To remove all tracepoints at the same line of code: | ||
|---|---|---|---|
|
|
A task or group of tasks may be unhooked so that they execute without intervention from the debugger.
To unhook a task or group of tasks:
* The debugger unhooks the selected task or group of tasks. The task buttons are set to the appropriate color (the default is blue) to indicate that they have been unhooked. Note that you can change the default colors used by pedb by updating the X defaults file.
This section describes how to use the Data Area of the pedb Window to examine your program's data. This area shows the names and values of variables in the current routine.
Each time execution of the program stops, the debugger automatically updates the information displayed.
In the pedb window, the Local Data, Global Data, Stack, Threads, and Break/Trace areas present information for each task in the current context. There are times when you want to stop displaying information for a particular task or task group in one or more of these areas. This allows you to conserve space in the area and improve the readability of information still displayed there.
For example, say you are debugging a master/worker program. The program has 15 identical worker tasks and you are stepping execution through them. Since the information displayed for each task is essentially the same, you might want to hide all but one. The information will then be easier to read and the information refreshes will be faster.
To hide a task's data, stack, threads,and break/trace information:
* A selection menu appears.
* The debugger no longer displays information for the task in the specified window. If you selected Hide All, the debugger hides the tasks information in all four areas. When you hide a window, the Hide option on the selection menu toggles to Show. You can then repeat these steps to again display the task's information in the specified window.
You can select a Break/Trace event and show the source line associated with it.
* The source window centers at the source line that is associated with the selected breakpoint and highlights that line.
* A menu pops up with two choices: Delete and Goto Source. Selecting Goto Source has the same effect as the double click described above.
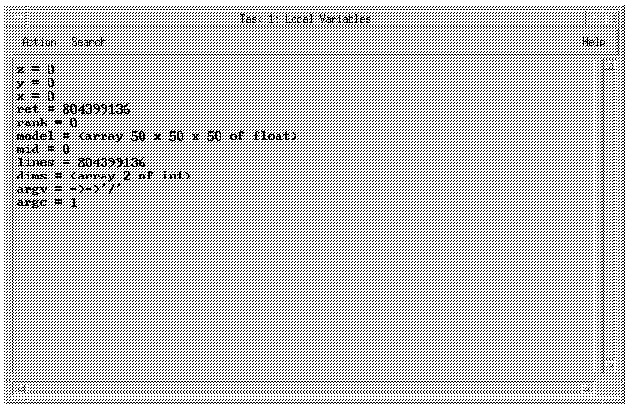
pedb displays the variables that are in scope within the local program block. The Stack Area lets you display, for any of the functions or subroutines listed, the local variables that are outside the local execution block (not on the top of the stack). To display these variables:
* The line highlights to show that it is selected, and the local variables associated with the function, subroutine, or unnamed block are displayed within the Local Data. All the data variable menu options are available.
| Note: | Local variables for the associated tasks that are outside the local execution block (not on the top of the stack), are displayed only until you issue another Stack Area selection or execution function within pedb. |
The pedb debugger will display program states about one thread of each task at a time. The source code, local variables, and stack trace for a task will be those of the displayed thread for the task. To select the displayed thread:
To select a stack entry:
* The line highlights to show that it is selected, and the local variables associated with the function, subroutine, or unnamed block are displayed within the Local Data. All the data variable menu options are available.
In pedb, you can view program data through either the Global Variable Viewer or the Local Variable Viewer. These windows display a specific type of data (global or local), and the way you use them depends on the programming language.
The Local Variable Viewer displays the variables, in C and Fortran, that are currently visible within your local execution block.
Stepping in and out of functions and subroutines during the debugging session will alter the list of local variables that the Local Variable Viewer displays. The Local Variable Viewer displays the set of variables for the function or subroutine that is at the top of the execution stack for a particular task.
The Global Variable Viewer displays the variables that are defined globally within the executing task. Global variables are only relevant when debugging C programs. Unless you specifically modify it, the list of global variables displayed in the Global Variable Viewer remains constant throughout the debugging session. Initially no global variables are displayed.
| Note: | xlf and xlc optimize out variables that are not referenced within a program. As a result, these variables may not be available in the Global or Local Data areas. |
The following table shows how variables are initially
displayed in the Data Area.
| In the Data Area, this type of variable: | Will initially be displayed: | For example: |
|---|---|---|
| scalar | with its value formatted according to its default type. |
x = 300 a = -.0001 b = 331.789978 char_val = 'W' |
| structure | with its type indicated. | struc_1 = <struct MyStruct_t> |
| array | with its type indicated. |
a = <array 8192 of int> x = <array 5 struct foo> z = <array 10 * of int> |
| pointer | with its type indicated |
Character Pointer examples: x = (nil); (unreferenced) x = > 0x4a567 (ptr to address) x = >>4; (dereferenced) Structure Pointer Examples: structx = (nil); (unreferenced) structx = > <struct foo> (dereferenced) |
| union | with its type indicated | MyOwnUnion_T = <union MyOwnUnion_T> |
| enum | with its value formatted according to its default type. | x = foo |
| logical | with its value formatted according to its default type. | do_this = .false |
Both the local and global variable windows are physically limited by the number and size of the variable information to be shown in the display. Therefore, conditions can exist where the user is unable to view all the data contained within the variable viewer due to geometry restriction on the pedb main window; or that the amount of data to be displayed exceeds the limitations of the window. In either of these cases, all of the variable list can be viewed using the Variable Viewer, which is an expanded form of the data window.
Initially, the variable list (local and global) is displayed in a list form, or in an iconic form. Note that when the condition of overflow occurs the variable list is replaced by the overflow icon.
Figure 8. Overflow icon
 View figure.
To view the variable list in its own window,
* A pop-up menu appears with an option Variable Viewer....
| Note: | The pop-up menu that appears for the local and global variable viewer will present a different set of options. |
* A separate window appears displaying the list of variables that was previously displayed in the local or global data area. The list (or icon) in the data areas on the main window of pedb should be replaced with the Variable Viewer icon.
Figure 9. Variable Viewer icon
 View figure.
The Variable Viewer window displays a list of global or local variables for a specified task. The task and type of data being displayed is identified by the title of the window. Figure 10 shows the Variable Viewer window displaying local variables for the specified task. Note that all of the variable pop-up menus options that are described in "Policies for Global Variables" are also available in this window.
Figure 10. Variable Viewer window
 View figure.
To close the variable window and return the variable list back to the main window:
* A pop-up menu should appear with a Close option.
* The window will close and return the contents back to the main window data area.
| Note: | Variables displayed in a task that is not in the current context will not be refreshed. |
The Local Variable subwindow for each task displays all the variables within the local execution block.
The Global Variable subwindow requires you to explicitly select the global variables you want to view. You can do this with the Variable Selection window.
To display a global variable:
* a pop-up menu appears with the following options:
* The Variable Selection window appears.
| Note: | The Variable Selection window shows only the global variables in your program that have accessible source files. If the source code of a particular program is not accessible, you may wish to use the -I flag, or the Source Path Window. |
a single variable by placing the cursor over it and depressing the left mouse button.
or
multiple, contiguous variables by depressing the left mouse button and dragging it over the range of variables.
or
multiple, non-contiguous variables by selecting the first variable and, while holding down the control key, selecting the next variable(s). Note that selecting a previously selected variable will de-select it.
or
OK
* Apply selects the variable(s) and leaves the Variable Selection window open. The variable(s) appear under the corresponding task label in the Global Data area.
OK selects the variable(s), as above, and closes the window.
Cancel discards your selection and closes the window.
In pedb, you can display threads data for tasks in the current context. You can view a list of threads and some detailed information about the condition variables, attributes, and mutual exclusion locks pertaining to each task.
The Threads area of the pedb main window displays a list of threads for each task. Any one of the threads is available to select. Initially, the interrupted thread is the displayed thread. You are free to change the displayed thread for any task.
Like the local and global variable viewers, when a window representing a task in the threads area reaches a threshold, the overflow icon is displayed. See "Understanding Data Types" for information on the local and global data viewer. At this time, you can open a Threads Viewer window, which contains the same information in the same format as in the Threads area for that task.
Figure 11. Threads Viewer window
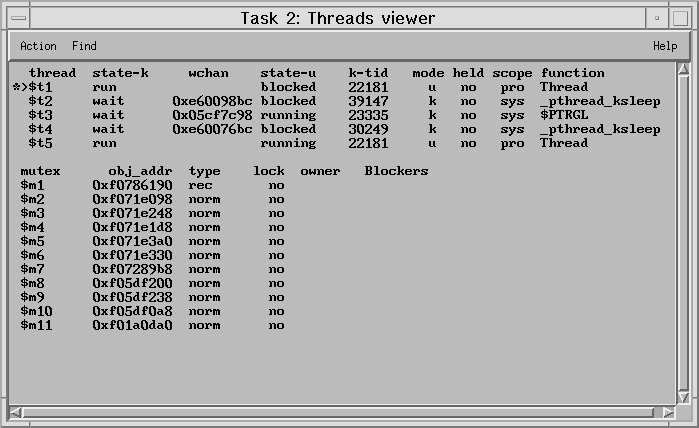 View figure.
The interrupted and displayed thread are denoted by "*" and ">" respectively. The ">" may move as you select different threads to display. The "*" does not change unless the program is executed and then stops again. The interrupted thread is important because it has an effect on further single stepping execution control. The displayed thread identifier is important because it denotes the thread that is represented in the stack, local variables, and source code windows.
To display a thread, go to the Threads area of the pedb main window:
* The Thread menu appears.
* The currently highlighted thread becomes the displayed thread. The stack, local variables, and source windows will update accordingly. You can also double click on a thread with the left mouse button to display it. In this way you bypass the Thread menu.
You can hold a thread from execution, and then release it again for execution. To do this, enable the Thread menu as in "Selecting a Thread to Display" above, then:
* This option controls whether the thread is dispatchable or not, and will affect subsequent execution control of the program. Held threads will not execute when single stepping or allowing the program to continue. Note that it is possible to induce hangs on other threads by holding a thread. When you select this option, the Thread menu disappears. The next time you enable the menu, the option will read "Release thread". The held field in the Threads area (of the pedb main window) for this thread will update appropriately when you select either of these options.
You can display the details of threads by opening the Threads Display menu. From the pedb main window:
* The Threads Display menu appears.
* The Select Display Details... option opens the Threads Details Selections window. From here you can choose what thread details to view. This option is available only when the task is in "debug ready" state; otherwise it is disabled. The Open Threads Viewer... option opens a separate window to display threads information for the task.
This window contains three toggle buttons that specify the additional thread information to be displayed in the Threads area or the Threads Viewer. You can choose any or all of:
After using this window to change the level of thread detail displayed, these changes you made for this task will persist across further execution control.
The Threads Viewer is another way to view threads data. It is similar to the local and global data viewer concept. One Threads Viewer is available for each task. It exists for two reasons. First, it overcomes the limitation in the display areas on the right side of the pedb main window when displaying large amounts of data. Second, it provides you with a separate and larger area for displaying threads data that interests you. You can iconify the Threads Viewer window separately.
The same actions are available in the Threads Viewer as in the Thread menu. Refer to "Selecting a Thread to Display" and "Holding a Thread from Further Execution" for this information. There is also a find selection in the Threads Viewer window main menu bar to allow finding strings within the displayed threads data.
The Threads Viewer window menu bar has three options available: Action, Find, and Help.
* The Select Display Details... option opens the Threads Details Selections window, as shown in "Displaying Thread Details". This option is only available when the task is in debug state, otherwise it is disabled. The Close Viewer option closes the Threads Viewer window, and either redisplays the contents of the window in the threads area (if there is enough room), or displays the overflow icon.
For a description of the Find option, see "Source File, Variable Viewer, and Threads Viewer Find".
If your application uses a threaded implementation of MPI, the debugger will display the existence and status of these threads even though you may not have explicitly coded threads. Refer to IBM Parallel Environment for AIX: Operation and Use, Volume 1, Using the Parallel Operating Environment, and IBM Parallel Environment for AIX: MPI Programming and Subroutine Reference for details.
This section describes how, with appropriate mouse clicks in the Data Area, you can bring up menus and windows to:
The More Detail and Less Detail variable options on the variable options menu operate differently depending on the data type of the selected variable. The following describes these differences.
Scalers, logicals, and enumerated types have one level of detail. The name of the variable and its value are displayed by default. The More Detail and Less Detail options are not available on the Variable Options menu for these variables.
Structures and unions have two levels of detail. They have their type displayed by default. To show more detail:
* The selection is highlighted.
* The Variable Options menu appears.
* This option shows the structure or union expanded with all members having their respective default levels of more or less.
After selecting More Detail, the Less Detail option then becomes available. When selected, Less Detail also shows the type of the structure or union. To show less detail:
An array has three levels of detail. The first level (the default) is its type, the second displays the array elements horizontally, and the third displays the elements vertically. When displaying the second level (horizontal), rows of more than 1000 characters are broken into multiple lines.
At the first level of detail, the More Detail option is available and when selected, shows the array elements horizontally. At the second level of detail, both the More Detail and Less Detail options are available. The Less Detail option will revert to the default of displaying the array type. The More Detail option, when selected, will then display the array elements vertically. At the third level of detail, the Less Detail option is available, and when selected, again shows the array elements horizontally.
Note that the default is to display one element of an array. To display more array elements, the Select Subrange option of the Variable Options menu must be selected to bring up the Array Subrange window (see "Viewing the Contents of an Array" for more information). This window allows selecting ranges, slices, and strides within the selected array. There is a limitation of displaying 1000 elements per array at one time.
Pointers to any other type have two levels of detail. By default, the second level of detail is displayed, any dereferencing is done, and the value of the native type is displayed. To show less detail:
* The Variable Options menu appears.
* This option shows the value of the pointer in 'hex' format, or the string at the pointer location in the case where the native type is 'char'.
Pointers with multiple levels of indirection, which point to other than 'char' types, have a level of detail for the native type and another level of detail for each level of indirection. By default, all pointer dereferencing is done and the value of the native type is shown. To show less detail on any level of indirection:
After any Less Detail option has been selected on any of the arrow pointers, subsequent selections anywhere on this variable to the right of any remaining arrows will result in bringing up a menu with the More Detail option available. If there are no remaining arrows, then selections anywhere on this variable will result in bringing up a menu with the More Detail option available. The More Detail option will always bring the variable back to the default of displaying the value of the native type.
You can select a variable in the Data area and modify its value.
To select a variable and change its value:
* The selection position is highlighted.
* A selection menu appears.
* The debugger displays a Change Value window that corresponds to the type of variable you selected.
* The debugger closes the Change Value window, and sets the variable to the value you specified.
Cancel closes the Change Value window and discards any changes.
You can select a variable in the Data area and change its displayed format. You could modify the format of a variable to:
| Note: | Some options may be inactive, depending on the type of variable selected. |
To select a variable and change its format:
* A selection menu appears. This menu is type-sensitive, so the only options it makes available to you are those that correspond to the type of variable you have chosen.
* A selection menu appears listing the possible display formats.
* The debugger formats the selected variable accordingly.
After selecting a variable in the Local Variable Viewer, Global Variable Viewer, or Variable Viewer for text, you can press the right mouse button to view the Variable Selection menu. From here you can select:
Change Format > Declaration
When selected, the declaration of the variable which was previously selected is displayed after the equal sign. This is only available for scalar types.
Default display:

   a = 5

Display after declaration format is chosen:

   a = int a;

      or

   a = integer*4 a
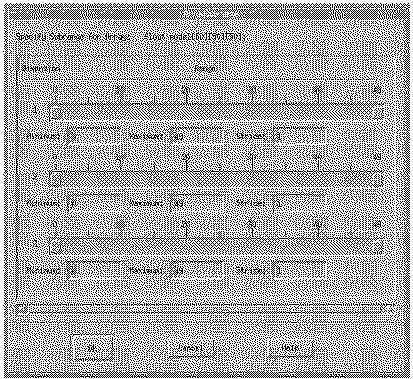
The Array Subrange window allows you to view the elements of an array. By defining the range of elements, you can control the portion of the array that you see. To open the Array Subrange window:
* the Variable Options menu appears.
* The Array Subrange window opens, shown in Figure 12.
Figure 12. Array Subrange window
 View figure.
The Specify Subrange for Array: area of the Array Subrange window allows you to specify the set of array cells that you want to display (per dimension). Each array dimension is presented in the form of a slider, which is labelled with a scale that represents the actual range for that dimension of the array. The slider has two markers; one marks the minimum value of the subrange, the other marks the maximum value. These values are reflected in the Minimum and Maximum fields below the slider. To define a subrange for display, you choose the minimum and maximum values of the subrange individually for each dimension.
You can define a subrange in one of two ways:
The Stride field accepts non-zero integer values. This value allows you to skip elements for each range. The default is 1, which selects every element within the subrange for that dimension. A stride of 2 specifies every other element, and so forth. Specifying a negative stride value reverses the order of elements from which the subrange is selected. After doing this, the order goes from Maximum to Minimum, instead of Minimum to Maximum.
| Note: | The maximum number of array elements that can be displayed is 1000. |
After you define the subrange with the appropriate values:
* The contents of the array elements that you specified are displayed, and the Array Subrange window closes. All subrange and stride specifications are retained for the next time the Array Subrange window is opened for this array on this task.
* The Array Subrange window closes, and all changes are discarded. All subrange and stride specifications when the window was opened are retained for the next time it is opened for this array on this task.
* Help information is displayed for the Array Subrange window.
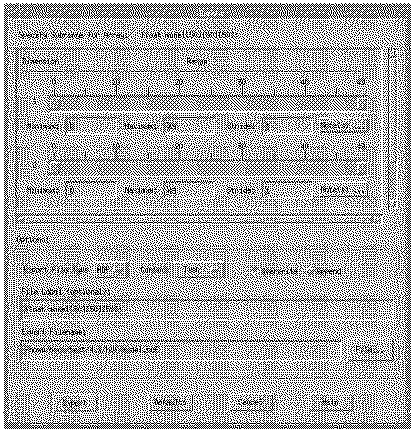
The Export window allows you to write elements of a C or Fortran array to a file in a specified data format. By defining the range of elements, you can control the portion of the array that is written to the file.
The format of the file is Hierarchical Data Format (HDF) Version 3.3. HDF is a standard format for scientific and visualization data. It was developed at the National Center for Supercomputing Applications (NCSA). See Appendix C. "Exporting Arrays to Hierarchical Data Format (HDF)" for more information on HDF.
The Export function is only available for arrays of integer and floating point data types.
The function of the Export window is completely independent from the function of the Array Subrange window, and vice versa. This means that any specifications for a particular array in one of these windows will not affect the specifications for the same array in the other.
To open the Export window:
* The Variable Options menu appears.
* The Export window opens, shown in Figure 13.
Figure 13. Export window
 View figure.
As with the Array Subrange window, the Export window allows you to specify the subrange of an array. For details on this area, see "Specifying the Array Subrange".
The Note(s) ... pushbutton allows you to enter optional information pertaining to the associated array dimension. Clicking on this button displays the Optional Notes window, shown in Figure 14, with fields to enter attribute annotations that are specific to the output file type. To edit any of the text fields, click on the field and type in the desired text.
Figure 14. Optional Notes window
 View figure.
After you annotate the dimensions with the appropriate information:
* The notes you entered are saved and the Optional Notes window closes.
* The Optional Notes window closes, discarding any changes.
* Help information is displayed for the Optional Notes window.
The following fields and buttons are available for you to specify aspects of the export:
Clicking on this with the left mouse button displays a menu that allows you to select the output format of the data to be written to a file. Currently, this menu has only one choice, which is HDF. This will result in the array contents being written in Hierarchical Data Format.
This option menu lets you select the tasks that will participate in the export, based on the criteria described below. This allows the selected array data to be written to one file in separate Scientific Data Sets, one set for each participating task.
The three choices for context are:
If the context setting is either "Current" or "All", the following criteria must be met for a task within the specified context to participate in the Export:
If any of the tasks within the context do not meet all of the above criteria, they will be excluded from the export, and a message will be displayed to inform you of this.
As stated above, the selected array data will be output to the HDF file as separate Scientific Data Sets. These data sets will be written to the file in order by task number.
Clicking on the Append button results in the selected array contents to be appended to the end of an existing HDF file. This allows you to collect the contents of multiple subranges from the same array, or contents of multiple arrays, and group this information in any order within the file. Clicking on the Overwrite button causes the specified file to be created if it doesn't already exist, or be completely overwritten if it does exist. The default file writing method is Overwrite.
The File Label is a text string annotation that is written to the file just prior to writing the selected array element data for each task participating in the export. The File Label is an optional annotation which has the declaration of the array as a default text string. You can either change the label or eliminate it entirely by clicking in the text field and editing it.
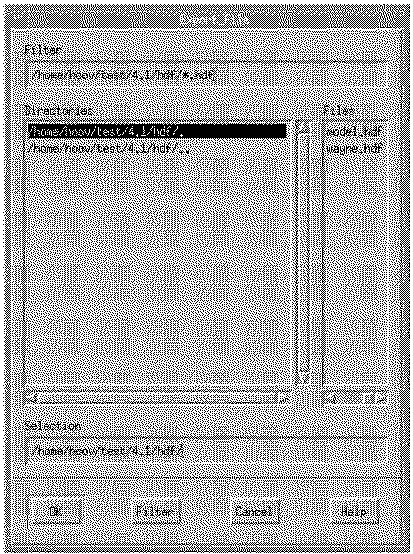
The Export Filename: field is a required field that specifies the name and path of the file that the array export data is written to. You can specify both the name of the file, and the directory where it will be located. There are two ways to do this:
Figure 15 shows the Export File Selection window. After making these selections, the Export Filename: field is updated with your choice.
The Export Filename: field contains a default path and file name every time the Export window is opened. The default path is the directory from which pedb was started, and the file name consists of the name of the array that you are exporting data for, along with a .hdf suffix.
Figure 15. Export File Selection window
 View figure.
Clicking on this button initiates the export of the selected array data to the specified file. The Export window remains open to allow additional exports on this array.
The export process can typically take more than a few seconds. When the export begins, an icon in the shape of a stop sign appears in the upper right hand corner of the Export window, and remains there until the export has completed. If you wish to stop an export that is in progress, click on this icon with the left mouse button.
Clicking on this button will reset all fields and states in the Export window back to the default settings that were used the first time this window was opened for this array on this task. The subranges for all array dimensions will be set back to their full ranges.
Pressing this button closes the window without exporting any data. The settings and specifications from the last export are retained for the next time the Export window is opened for this array on this task. If an export was not performed while the window was open, the settings and specifications when the window was opened for this array on this task are retained.
This button displays help information for the Export window.
This section describes the pedb debugger's message queue facility. Part of the pedb debugger interface, the message queue viewing feature is designed to help you debug Message Passing Interface (MPI) applications by showing internal message request queue information. This feature allows you to view:
It is possible that there could be problems when pedb does it's initial checking. For example:
If either of these problems are discovered, an error message will appear, and the message queue debugging window will not appear, or will close.
When you start the message queue facility, it is possible that MPI has not initialized yet. If this is true, the initial message queue window will indicate that there is no data. The following describes this case in more detail.
During the initial checking, the debugger also determines the mode in which the MPI application is running. If it is not running in "debug" mode, the data will not include information on blocking messages. Debug mode is achieved by setting the MP_EUIDEVELOPenvironment variable to DEB. For more information on MP_EUIDEVELOP, refer to IBM Parallel Environment for AIX: Operation and Use, Volume 1, Using the Parallel Operating Environment. If the application is not running in debug mode, a warning message will be displayed along with the initial message queue debugging window.
Requesting information for any of the message queue windows causes the cursor to change to a "stopwatch" Further requests are disabled until the current request has finished. While the stopwatch is showing, the pedb main window is disabled. If a problem occurs, or a request is taking too much time, the message queue windows can be cancelled by pressing the Cancel button on the Application Message Queues window. This closes all message queue windows and enables the pedb main window. Pressing the Cancel button on the Application Message Queues window will always have the effect of closing all the message queue debugging windows.
| Note: | You can customize the colors used in any of the message queue windows. You can define these resources in the pedb X defaults file /usr/lpp/ppe.pedb/defaults/Pedb.ad. |
To start the message queue facility, from the pedbmain menu area:
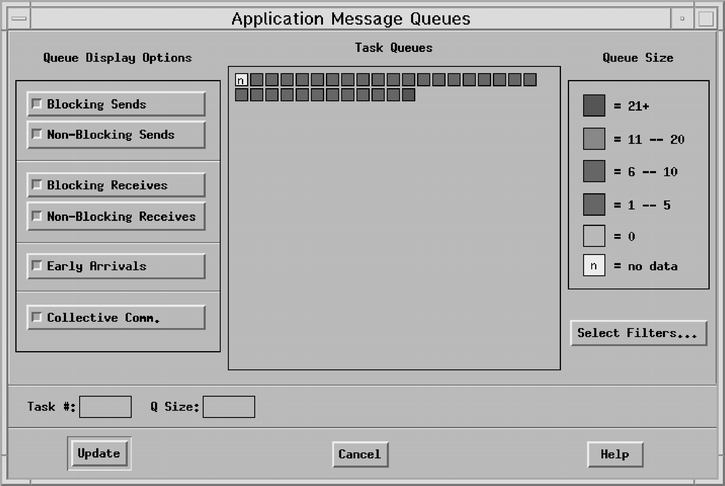
* The Application Message Queues window opens.
Figure 16. Application Message Queues window)
 View figure.
The Application Message Queues window displays message queue summary information and provides a starting point for additional message queue debugging features.
The center of the Application Message Queues window contains a set of buttons representing all the tasks defined for the MPI application. The color of each button indicates the approximate size of the queue. The interpretation of the colors is given in the Queue Size scale on the right side of the window.
To further assist in interpreting these buttons, there is a message area at the bottom of the window containing the task identifier and the actual queue size. These values are filled in automatically when you move the cursor over one of the task buttons. On the right side of this area, informational messages appear at appropriate times.
This window also contains a list of Queue Display Options on the left side, and a Select Filters... button on the right, under the Queue Size scale. The criteria for selecting summary information can be modified by selecting these options and filters. Once you set option and filter information, it remains set for future updates until you change it.
| Note: | You should use caution when leaving criteria set, since this can incur considerable overhead, especially in the case of filters. |
See "Selecting Options", and "Select Filters Window" for more information.
When you first open this window, it contains summary information that includes all types of messages, including early arrivals. Early arrivals refer to messages that have arrived at a task, but have no posted receives to accept them.
A button with a tan colored (default color) background and labeled with an "n" indicates there is currently no data available for that task. There could be many reasons for no available data. Basically, there is no data unless a task is in "debug" state, as indicated by the task buttons at the bottom of the pedb main window. Also, no data is available unless a task is in the current debugger context. The reason for a task not having any data is displayed in the right side of the message area when you move the cursor over the task button.
Pressing the Cancel button on this window causes all message queue windows to close.
On the left side of the window there is a series of toggle buttons representing different categories of messages. When you first open the window, all the toggles are selected indicating the summary information is being collected for all categories. You can select or deselect any combination of these options for future summary information. Once you make the selections, you can retrieve the summary information by pressing the Update button at the bottom of the window.
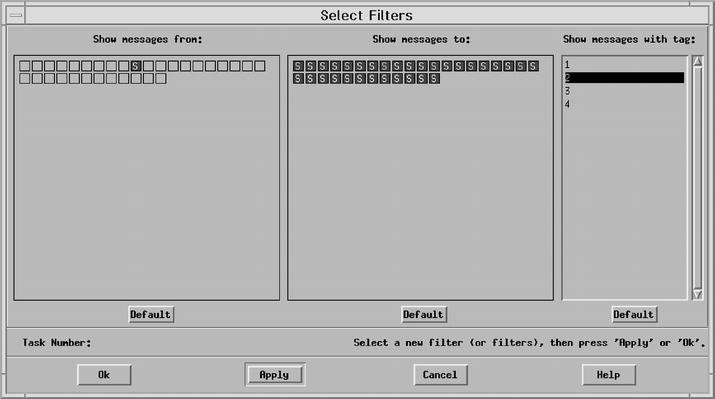
Another way to set the criteria for gathering summary information is by using the Select Filters window. To open this window:
* The Select Filters window opens.
Figure 17. Select Filters window
 View figure.
The Select Filters window is used to set source, destination, and tag values as selection criteria for message queue summary information.
This window consists of three categories of filters you can set:
Both the source and destination areas contain a set of buttons representing tasks defined for the application. The corresponding task numbers are displayed in the bottom left hand side of the window when you move the cursor over the buttons. You can select one task by pressing the task button. You can select multiple contiguous tasks by pressing and holding the left mouse button and moving the pointer across the desired tasks. Also, you can select multiple non-contiguous tasks by holding down the Ctrlkey and selecting individual or contiguous tasks.
The "Show messages with tag:" list on the right side of the window is created by extracting all the unique tags from the message records of the available tasks. The way you select tags is similar to the way you select the other filters, except lines of the tag list are selected instead of task buttons.
You can select one or more values from each category. If you do not want a specific setting, press the default button to select all possible values. Any value found in a message is acceptable and meets the criteria. You should select at least one value for each category. In other words, a message record satisfies the filter criteria if it has one source value, one destination value, and one tag value. The window opens displaying the current settings.
| Note: | Once the filters are set, you need to go back to the Application Message Queues window to request an update. |
The default queue size ranges on the Application Message Queues window may not be appropriate for all MPI applications. You can adjust the top three ranges to more reasonable sizes. To modify the range for a particular button:
The color of the small square in this window corresponds to the color of the range button, to help you keep track of which button is being changed. To change the minimum value:
* The minimum value of this range and the maximum value of the previous lower range is adjusted. If you attempt to set the minimum value lower than the previous range minimum value plus one, you will get an error message. You are responsible for not defining overlapping maximum ranges.
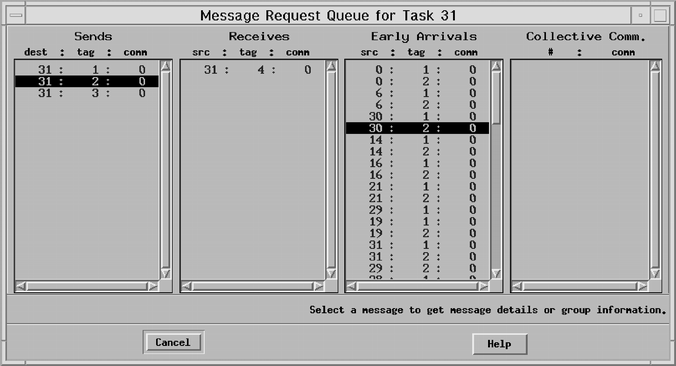
You can also get further information on a particular task's message queue by opening the Task Message Queue window. On the Application Message Queues window:
* The Task Message Queue window opens. The number of the task the cursor is on and the actual queue size is displayed in the lower left side of the Application Message Queues window.
Figure 18. Task Message Queue window
 View figure.
The Task Message Queue window gives a list of the message request records and early arrival records for the task. This window displays the queue of currently active messages for this task. The information is separated into four categories:
Each entry represents a unique message. Entries in the first three categories provide the tag, communicator, and source or destination of the message. The source and destination is given in terms of task id. Entries in the Collective Communications column contain an arbitrary message index and the communicator. Blocking message entries are printed in red and non-blocking messages are printed in blue.
The early arrival messages are unique in that they represent messages sent by a task that have arrived before a receive has been posted to accept them.
From this window you can get additional message details or message communicator and group data. To view this data:
* The Message Data menu opens.
To open the Message Details window:
This window displays details for a specific message. There are four basic formats to this window corresponding to point to point, send/receive, collective communication, and early arrival messages. The following figures show examples of each window.
Figure 19. Point to Point Message Details window
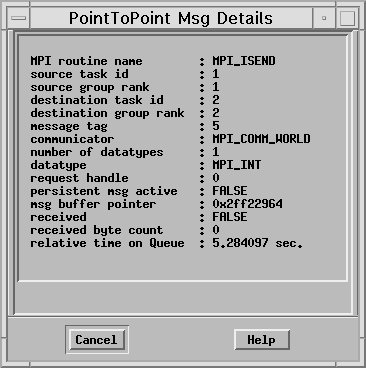 View figure.
Figure 20. Send/Receive Message Details window
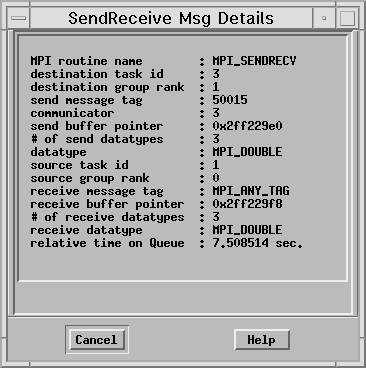 View figure.
Figure 21. Collective Communications Details window
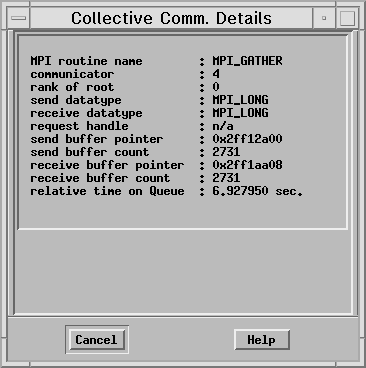 View figure.
Figure 22. Early Arrival Message Details window
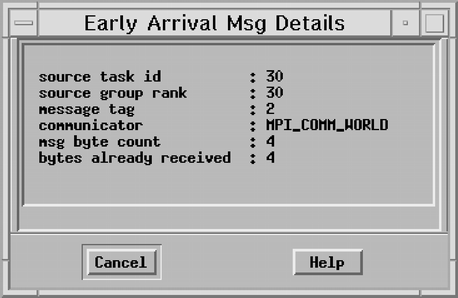 View figure.
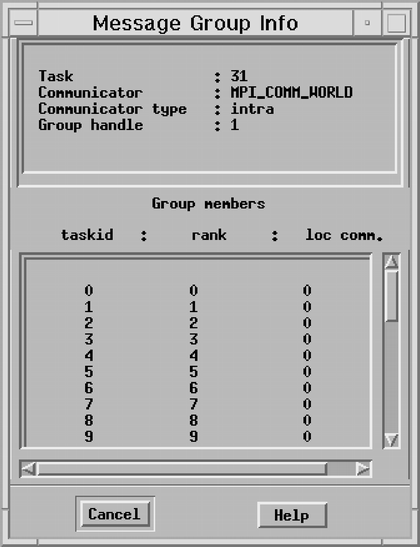
To open the Message Group Information window:
This window displays information about the selected message followed by the task id, rank, and local communicator of the group members. The format of the window varies based on whether the communicator is an inter-communicator or an intra-communicator. If it is an intra-communicator, the window displays information about both the local and remote groups.
Figure 23. Message Group Information window
 View figure.
Message queue information is retrieved from the task (executable) when it has been stopped by the debugger and is in pedb "debug" state. The task buttons at the bottom of the pedb main window indicate "debug" state. When the task is executed by the debugger, by stepping, etc., the message queue could potentially change. Therefore, it is necessary to update the message queue information when the task returns to "debug" state.
If the message queue debugging features are currently being used, the debugger automatically updates the message queue windows when the task returns to "debug" state after being executed. The procedure for updating is as follows:
The Visualization window allows you to select elements of a C or Fortran array, and display the data in those elements using data visualization tools of your choice. By defining the range of elements, you can control the portion of the array that is visualized. Two types of visualizations are available with this feature: pre-packaged and user-defined.
The Visualization function is only available for arrays of integer and floating point data types.
To open the Visualization window:
* A pop-up menu appears.
* The Visualization window opens, shown in Figure 24.
Figure 24. Visualization window
 View figure.
Clicking on the raised button in this field results in a menu being displayed to allow you to choose the method for visualizing the selected array data. The first five menu options are pre-defined visualization methods for IBM's Visualization Data Explorer product. To execute these visualizations, the Data Explorer runtime fileset is required (see Appendix D. "Visualization Customization and Data Explorer Samples" for more information). The last five options are available for you to call user-defined visualization tools. The default value is set to "DX 2D Colormap". This menu, and the tools that can be invoked from it, are able to be customized.
The interface to the pre-defined samples is the same as that used with user-defined visualizations. Therefore, you can modify or replace them, if desired. Additional Data Explorer visualizations are included in a samples directory, but not pre-defined on the pedb user interface. The user-defined options are set up through the X defaults file and through a separate configuration script.
The following Data Explorer visualizations are pre-defined:
The following are included in a samples directory:
The samples directory holds all of the visualization scripts (.net and .cfg files in Data Explorer terminology). It also includes the source for the program with which pedb interfaces to Data Explorer, and a makefile for the sample source.
You can insert your own visual tools for the debugger to invoke. When you define visualizations, you need a common method for integrating your applications.
A two step process is required to enable the tools you define and integrate with pedb:
Pedb*VisualTypeOption_1.labelString:  DX Colormap


changes to


Pedb*VisualTypeOption_1.labelString:  User Tool 1
| Note: | You can edit your .Xdefaults file from your $HOME directory using the Pedb.ad file as a reference to the things you can change. |
/usr/lpp/ppe.pedb/bin/VisualTypeOption_1.ksh
By modifying this shell script, you can direct pedb to call your own tools.
This option menu lets you select the tasks for which array data will be visualized, based on the criteria described below. In the visualization process, the selected array data is written in HDF format to a temporary file located in /tmp. Certain context settings allow the selected array data to be written to the temporary file in separate Scientific Data Sets, one set for each participating task.
The three choices for context are:
| Note: | Context settings of "Current" or "All" result in multiple data sets being written to a temporary file for visualization. Verify that the tool you have chosen to perform the visualization allows you to visualize more that one data set at a time. |
If the context setting is either "Current" or "All", the following criteria must be met for a task within the specified context to participate in the data visualization:
If any of the tasks within the context do not meet all of the above criteria, they will be excluded from the visualization, and a message will be displayed to inform you of this.
As stated above, the selected array data will be output to the HDF file as separate Scientific Data Sets. These data sets will be written to the file in order by task number. The visualization program is required to determine the order in which the data will be visualized.
For details on this area, see "Specifying the Array Subrange".
Clicking on this button initiates the visualization of the selected array data. The Visualization window remains open to allow additional visualizations on this array. The visualization program will be re-initialized each time this button is pressed. This will create multiple instances of the visual, rather than refreshing the data from the previous visualization.
Transferring data for visualization can typically take more than a few seconds. When the data transfer begins, an icon in the shape of a stop sign appears in the upper right hand corner of the Visualization window, and remains there until the data transfer has completed. If you wish to stop a data transfer that is in progress along with the visualization, click on this icon with the left mouse button.
Clicking on this button will reset all fields and states in the Visualization window back to the default settings that were used the first time this window was opened for this array on this task. The subranges for all array dimensions will be set back to their full ranges.
Pressing this button closes the window without initiating the visualization. The settings and specifications from the last visualization are retained for the next time the Visualization window is opened for this array on this task. If a visualization was not performed while the window was open, the settings and specifications when the window was opened for this array on this task are retained.
This button displays help information for the Visualization window.
During a pedb session, the source code file displayed in the Source Area may change many times. Each time execution of the tasks in a context stops, the debugger updates the pedb window and checks that the source code displayed matches the program counter. For example, if execution has stopped in a procedure located in a different file, the debugger automatically updates the Source Area to display the current source.
When tasks have stopped in different source files, the lowest numbered task in debugged state in the group determines the source file displayed. This excludes tasks which are unhooked, exit requested, or exited.
To display the source from a different task, you can either change the context or open a view with a different context. You can also change the current source code displayed by opening a source code file using the Source File(s) window, selecting a line in the stack window, or double clicking on a thread in the Threads window.
You can open a source code file and display it in the Source Area using the Source File(s) window. To do this:
* The Source File(s) window opens.
This window contains a list of accessible source files associated with your program that have been compiled with the -g flag. The source path is used to find the files.
* The File Selection window closes, and the source code of the selected file appears in the Source Area.
The first default path searched is " ." (the current directory). If you do not explicitly specify a path when choosing a file to load, pedb uses the AIX path established by the PATH environment variable to locate the file. The path in which the program is located, whether explicitly specified or not, is added to the end of the list of directories searched for source files.
You may explicitly set the source code search path on the command line when invoking pedb using -I flags. The effective search path is set to the -I paths specified, in the order they appear on the command line. If you do not explicitly set it, the source code search path is based on the program(s) you load for debugging in the partition, as described above.
During your pedb session, the search path used to locate source files may be modified. You may edit it, adding new paths or deleting or changing existing ones. This is helpful when source is distributed in multiple directories and you step into a source file which is located in a directory you missed at startup.
* The Update Source Path window opens.
* The Update Source Path window closes. Subsequent source files will be accessed using the new path.
Cancel closes the Update Source Path window without changing the current source path.
You can edit the source file which is shown in the source area by selecting the Edit Source File menu from the File pulldown menu on the main window.
* You open an edit session in an aixterm window.
Notes:
Use the Find option to locate text in the source code, Variable Viewer, or Threads Viewer. You first open the Find window and specify the text to find. Once you have entered text, the find options are enabled. The find options are available from the menu bar pulldown and from buttons in the Find window. Accelerators <ctrl-f>, <ctrl-n>, <ctrl-p>, and <ctrl-l> are available for First, Next, Previous, and Last respectively. Search results are displayed differently for the source code window and the Variable or Threads Viewer.
To find text in the source code window, Variable Viewer, or Threads Viewer, go to the menu bar.
* You see a pulldown menu with the following options:
To open the Find window, go to the menu bar in the Main window or Variable Viewer.
From the Main window:
From the Variable Viewer:
* The Find window opens as shown in Figure 25. The Find window title will indicate if you are using Find from the source code window or the Variable Viewer.
Figure 25. Find window
 View figure.
Enter the text to find in the text field. Entering text automatically enables the find option buttons in the window and the menu bar. Pressing Enter in the text field is the same as pressing the Next button. Use the Case sensitive toggle button to ignore the case of the text when searching. At the bottom of the Find window are the following buttons:
If the search fails, a message is displayed in the information area indicating the search direction and the actual string used in the search. You may want to broaden the search by specifying fewer characters or using the Case sensitive toggle button to ignore case.
When text is found in the source window or Threads Viewer, the entire line containing the text is highlighted. This becomes the current line, and the reference point for locating the next and previous occurrences.
When text is found in the Variable Viewer, the text that was matched is highlighted. The first character of the text is the reference point for the Variable Options pop-up menu as described in "Data Display Techniques".
pedb provides source code emphasis when displaying code in the source area of the main window. For example, the language symbols, variable and function names, and comments are all displayed in different colors. See Table 9 below for details.
The debugger scans the current source file to identify elements of the language. Each element is then drawn with a different foreground and background color to emphasize that element. This may help you to quickly identify points of interest in your source code. It is particularly useful when you are not familiar with the code being debugged. Instead of scrutinizing the code to identify variables and comment blocks, their color will automatically alert you to their function.
To turn this feature off, set Pedb*SourceEmphasis: False in your .Xdefaults file, or use the toggle button on the menu bar:
File > Source Emphasis
The following table lists the default color scheme for each language
element identified. Each resource can be given a unique color, but be
aware that each unique color used will increase the total number of colors
required for pedb. Resource values are any valid color
specification for your system, for example, the values found in
/usr/lpp/X11/lib/X11/rgb.txt.
Notes:
#ifdef DEBUG

#endif
pedb will identify the directives and the elements within the block, but cannot determine if DEBUG was set at compile time.
Some other features offered by pedb include the capabilities of displaying multiple views, and linking to online help.
You can think of pedb as a window into the debug space. The window you have is just one way of looking into the debug space, and depends on the current context, the source code displayed in the Source Area, the variables, and the stack trace. You can open multiple pedb windows and have multiple views into the same debug space.
For example, you have two tasks - tasks 0 and 1 - involved in message passing. You could open two pedb windows to follow send and receive pairs between the two tasks. In one window, you would set the context on task 0. In the other, you would set the context on task 1. You could then step execution past the send in one window, and then step execution past the receive in the other.
When dealing with multiple views into the same debug space, keep in mind that actions made on one pedb window may be reflected on the others. For example, say you have two views into the same debug space. The context of one is set on just task 0, while the context of the other is set on all the tasks including task 0. If you step all the tasks in the second window, the first window also reflects the step.
To open another pedb window to provide an additional view into the debug space:
* Another pedb window opens.
To close a pedb window:
There are help buttons on most windows and help options on many menus. Selecting these help buttons or options provide built-in online help for the particular window or menu from which the help was selected.
The pedb main window includes a Help button to access online help in a variety of ways by selecting one of the following options:
Displays built-in online help information about the pedb main window. There are main window left and right button presses that may not be obvious. Here you will find a list of the actions available using the buttons on the main window.
Displays built-in online help for the main window menu bar pop-up menus: File, View, Group, Find, and Options.
Displays a list of the built-in online help items that are available on the various windows and menus throughout the pedb debugger. Any of the listed items can be selected, which results in a window displaying that help section.
Notes:
Customizable resources for pedb are defined in /usr/lpp/ppe.pedb/defaults/Pedb.ad (the pedb X defaults file). In this file is a set of X resources for defining graphical user interfaces based on the following criteria:
It is possible to end the debug session at any time using either the Quit option, or the Detach option if debugging in attach mode.
To end a debug session in normal mode:
* The Quit Confirmation window appears.
* The pedb window closes and you return to the window from which you started pedb.
To end a debug session in attach mode, you can choose either Quit or Detach. Quitting causes the debugger and all the members of the original poe application partition to exit. Detaching causes only the debugger to exit and leaves all the tasks running.
* The Quit Confirmation window appears.
* The debugger session ends, along with the poe application partition tasks.
* The Detach Confirmation window appears.
* The debugger session ends. All tasks have exited, but stay running.
Clicking on this button causes pedb to exit, and allows the program to which you had attached to continue execution if it hasn't already finished. If this program has finished execution, and is part of a series of job steps, then detaching allows the next job step to be executed.
If instead you want to exit the debugger and end the program, cancel the Detach Confirmation window and use the Quit option as described above.