 View figure.
This chapter describes how to profile your programs with the Xprofiler profiling tool of the IBM Parallel Environment for AIX. This chapter explains how to use the Xprofiler graphical user interface (GUI) to profile your application, so it is best to read it while you have the GUI up and running.
If you intend to use the AIX gprof command to profile your parallel application, see Appendix C. "Profiling Programs with the AIX prof and gprof Commands" for information on how to do so. You may also find it helpful to consult the IBM AIX Version 4 Commands Reference
You do not need to be familiar with the AIX gprof command to use Xprofiler.
Xprofiler is a tool that helps you analyze your parallel application's performance quickly and easily. It uses data collected by the -pg compiling option to construct a graphical display of the functions within your application. Xprofiler provides quick access to the profiled data, which lets you identify the functions that are the most CPU-intensive. The graphical user interface also lets you manipulate the display in order to focus on the application's critical areas.
Xprofiler lets you profile both serial and parallel applications. The difference is that when you run a serial application, a single profile data file is generated, while a parallel application produce multiple profile data files. Either way, you can use Xprofiler to analyze the resulting profiling information.
Xprofiler provides a set of resource variables that let you customize some of the features of the Xprofiler window and reports. For information about customizing resources for Xprofiler, see IBM Parallel Environment for AIX: Operation and Use, Volume 2, Tools Reference
The word function is used frequently throughout this chapter. Consider it to be synonymous with the terms routine, subroutine, and procedure.
To use Xprofiler, your application must be compiled with the -pg option. For more information about compiling, see "Compiling Applications to be Profiled".
Like gprof, Xprofiler lets you analyze CPU (busy) usage only. It cannot give you other kinds of information such as CPU idle, I/O, or communication.
To run Xprofiler, AIX 4.2.1 (or later) must be installed on your machine.
If you compile your application on one machine, and then analyze it on another, you must first make sure that both machines have similar library configurations, at least for the system libraries used by the application. For instance, say you ran an HPF application on an SP, then tried to analyze the profiled data on a workstation. The levels of HPF runtime libraries must match, and must be placed in a location that Xprofiler recognizes on the workstation. Otherwise, Xprofiler produces unpredictable results.
Since Xprofiler collects data by sampling, short-executing functions may show no CPU use.
Xprofiler does not give you information about the specific threads in a multi-threaded program. The data that Xprofiler presents is a summary of the activities of all the threads.
With Xprofiler, you can produce the same tabular reports that you may be accustomed to seeing with gprof. Just as with gprof, you can generate the Flat Profile, Call Graph Profile, and Function Index reports. Xprofiler is different from gprof in that it provides a graphical user interface (GUI) from which you can profile your application. It generates a graphical display of your application's performance, as opposed to just a text-based report. Unlike gprof, Xprofiler also lets you profile your application at the source statement level.
From the Xprofiler GUI, you can use all the same command line flags as gprof, plus a few more that are unique to Xprofiler.
In order to use Xprofiler, you must compile and link your application with the -pg option of the compiler command. This applies regardless of whether you are compiling a serial or parallel application. You can compile and link your application all at once, or perform the compile and link operations separately. Here's an example of how you would compile and link all at once:
cc -pg -o foo foo.c
And here's an example of how you would first compile your application and then link it. To compile:
cc -pg -c foo.c
To link:
cc -pg -o foo foo.o
Notice that when you compile and link separately, you must use the -pg option with both the compile and link commands.
The -pg option compiles and links the application so that when you run it, the CPU usage data gets written to one or more output files. For a serial application, this output consists of just one file called gmon.out, by default. For parallel applications, the output is written into multiple files, one for each task that is running in the application. To prevent each output file from overwriting the others, POE appends the task ID to each gmon.out file. For instance, gmon.out.10.
The -pg option is not a combination of the -p and the -g compiling options.
| Note: | You must set the LIBPATH environment variable to the profiled POE libraries in order to profile system libraries (like libc). For more information, see IBM Parallel Environment for AIX: Operation and Use, Volume 2, Tools Reference |
In order to get a complete picture of your parallel application's performance, you must indicate all of its gmon.out files when you load the application into Xprofiler. When you specify more than one gmon.out file, Xprofiler shows you the sum of the profile information contained in each file.
The Xprofiler GUI provides the capability of viewing included functions. Note, however, that your application must also be compiled with the -g option in order for Xprofiler to display the included functions.
The -g option, in addition to the -pg option, is also required for source statement profiling.
You start Xprofiler from the AIX command line, using the xprofiler command. To use Xprofiler, you also need to specify the executable file (a.out), the profile data file (gmon.out), and any command line options.
Under some circumstances you may have multiple profile data files (gmon.out files). You will have more than one of these files if you are profiling a parallel application, because a gmon.out file is created for each task in the application when it is run. If you are running a serial application, there may be times when you want to summarize the profiling results from multiple runs of the application. In these cases, you will need to specify each of the profile data files you want to profile with Xprofiler.
You start Xprofiler by issuing the xprofiler command from the AIX command line. You also need to specify the executable, profile data file(s), and options, which you can do one of two ways. You can either specify them on the command line, with the xprofiler command, or you can issue the xprofiler command alone, then specify them from within the GUI. See "Loading Files from the Xprofiler GUI".
To start Xprofiler and specify the executable, profile data file(s), and options:
where a.out is the binary executable file, gmon.out is the name of your profile data file(s), and options may be one or more of the options listed in "Xprofiler Command Line Options".
To print basic Xprofiler command syntax to the screen, use the -h or -? option with the xprofiler command from the command line. For example, xprofiler -h.
You can specify the same command line options with the xprofiler command that you do with gprof, plus one additional option (-disp_max), which is specific to Xprofiler. The command line options let you control the way Xprofiler displays the profiled output.
When you enter an option, there must be a space between the option and its corresponding value. For example,
-e main
You can specify the following options from either the Xprofiler GUI or the command line. See "Specifying Command Line Options (from the GUI)" for more information.
The Xprofiler command line options are:
Table 1. Xprofiler Command Line Options
| Use this flag: | To: | For example: |
|---|---|---|
| -b | Suppresses the printing of the field descriptions for the Flat Profile, Call Graph Profile, and Function Index reports when they are written to a file with the Save As option of the File menu. | To suppress printing of the field descriptions for the Flat Profile, Call
Graph Profile, and Function Index reports in the saved file: file,
|
| -s | If multiple gmon.out files are specified when Xprofiler is started, produces the gmon.sum profile data file. The gmon.sum file represents the sum of the profile information in all the specified profile files. Note that if you specify a single gmon.out file, the gmon.sum file contains the same data as the gmon.out file. | To write the sum of the data from three profile data files,
gmon.out.1, gmon.out.2, and
gmon.out.3, into a file called
gmon.sum:
|
| -z | Includes functions that have both zero CPU usage and no call counts in the Flat Profile, Call Graph Profile, and Function Index reports. A function will not have a call count if the file that contains its definition was not compiled with the -pg option, which is common with system library files. | To include all functions used by the application, in the Flat Profile,
Call Graph Profile, and Function Index reports, that have zero CPU usage and
no call counts:
|
| -a | Adds alternative paths to search for source code and library files, or changes the current path search order. When using this command line option, you can use the "at" symbol (@) to represent the default file path, in order to specify that other paths be searched before the default path. | To set the alternative file search path(s) so that Xprofiler searches
pathA, the default path, then pathB:
|
| -c | Loads the specified configuration file. If the -c option is used on the command line, the configuration file name specified with it will appear in the Configuration File (-c): text field in the Load Files Dialog, and the Selection field of the Load Configuration File Dialog. When both the -c and -disp_max options are specified on the command line, the -disp_max option is ignored, but the value that was specified with it will appear in the Initial Display (-disp_max): field in the Load Files Dialog, the next time it is opened. | To load the configuration file:
|
| -disp_max | Sets the number of function boxes that Xprofiler initially displays in the function call tree. The value supplied with this flag can be any integer between 0 and 5,000. Xprofiler displays the function boxes for the most CPU-intensive functions through the number you specify. For instance, if you specify 50, Xprofiler displays the function boxes for the 50 functions in your program that consume the most CPU. After this, you can change the number of function boxes that are displayed via the Filter menu options. This flag has no effect on the content of any of the Xprofiler reports. | To display the function boxes for only 50 most CPU-intensive functions in
the function call tree:
|
| -e | De-emphasizes the general appearance of the function box(es) for the
specified function(s) in the function call tree, and limits the number of
entries for these function in the Call Graph Profile report. This also
applies to the specified function's descendants, as long as they have not
been called by non-specified functions.
In the function call tree, the function box(es) for the specified function(s) appears greyed-out. Its size and the content of the label remain the same. This also applies to descendant functions, as long as they have not been called by non-specified functions. In the Call Graph Profile report, an entry for the specified function only appears where it is a child of another function, or as a parent of a function that also has at least one non-specified function as its parent. The information for this entry remains unchanged. Entries for descendants of the specified function do not appear unless they have been called by at least one non-specified function in the program. | To de-emphasize the appearance of the function boxes for foo
and bar, as well as their qualifying descendants in the function
call tree, and limit their entries in the Call Graph Profile report:
|
| -E | Changes the general appearance and label information of the function
box(es) for the specified function(s) in the function call tree. Also
limits the number of entries for these functions in the Call Graph Profile
report, and changes the CPU data associated with them. These results
also apply to the specified function's descendants, as long as they have
not been called by non-specified functions in the program.
In the function call tree, the function box for the specified function appears greyed-out, and its size and shape also changes so that it appears as a square of the smallest allowable size. In addition, the CPU time shown in the function box label, appears as 0 (zero). The same applies to function boxes for descendant functions, as long as they have not been called by non-specified functions. This option also causes the CPU time spent by the specified function to be deducted from the left side CPU total in the label of the function box for each of the specified function's ancestors. In the Call Graph Profile report, an entry for the specified function only appears where it is a child of another function, or as a parent of a function that also has at least one non-specified function as its parent. When this is the case, the time in the self and descendants columns for this entry is set to 0 (zero). In addition, the amount of time that was in the descendants column for the specified function is subtracted from the time listed under the descendants column for the profiled function. As a result, be aware that the value listed in the % time column for most profiled functions in this report will change. | To change the display and label information for foo and
bar, as well as their qualifying descendants in the function call
tree, and limit their entries and data in the Call Graph Profile report:
|
| -f | De-emphasizes the general appearance of all function boxes in the
function call tree, except for that of the specified function(s)
and its descendant(s). In addition, the number of entries in the Call
Graph Profile report for the non-specified functions and non-descendant
functions is limited. The -f flag overrides the
-e flag.
In the function call tree, all function boxes except for that of the specified function(s) and its descendant(s) appear greyed-out. The size of these boxes and the content of their labels remain the same. For the specified function(s), and its descendant(s), the appearance of the function boxes and labels remain the same. In the Call Graph Profile report, an entry for a non-specified or non-descendant function only appears where it is a parent or child of a specified function or one of its descendants. All information for this entry remains the same. | To de-emphasize the display of function boxes for all functions in the
function call tree except for foo, bar, and
their descendants, and limit their types if entries in the Call Graph Profile
report:
|
| -F | Changes the general appearance and label information of all function
boxes in the function call tree except for that of the specified
function(s) and its descendants. In addition, the number of entries in
the Call Graph Profile report for the non-specified and non-descendant
functions is limited, and the CPU data associated with them is changed.
The -F flag overrides the -E flag.
In the function call tree, all function boxes except for that of the specified function(s) and its descendant(s) appear greyed-out. The size and shape of these boxes also changes so that they appear as squares of the smallest allowable size. In addition, the CPU time shown in the function box label, appears as 0 (zero). In the Call Graph Profile report, an entry for a non-specified or non-descendant function only appears where it is a parent or child of a specified function or one of its descendants. When this is the case, the time in the self and descendants columns for this entry is set to 0 (zero). As a result, be aware that the value listed in the % time column for most profiled functions in this report will change. | To change the display and label information of the function boxes for all
functions except the functions foo and bar
and their descendants, and limit their types of entries and data in the Call
Graph Profile:
|
| -L | Sets the pathname for locating shared libraries. If you plan to specify multiple paths, use the Set File Search Path option of the File menu on the Xprofiler GUI. See "Setting the File Search Sequence" for information. | To specify /lib/profiled/libc.a:shr.o as
an alternate pathname for your shared libraries:
|
After you issue the xprofiler command, the Xprofiler main window appears, and displays your application's data.
If you issue the xprofiler command without specifying an executable file, a profile data file, or options, you may do so from within the Xprofiler GUI. You use the Load File option of the File menu to do this.
When you issue the xprofiler command alone, the Xprofiler main window appears. Since you did not load an executable or specify a profile data file, the window will be empty.
If you issue the xprofiler command with the -h option only, Xprofiler displays the syntax for the command and then exits.
Figure 1. Xprofiler Main Window with No Executables Loaded
View figure.
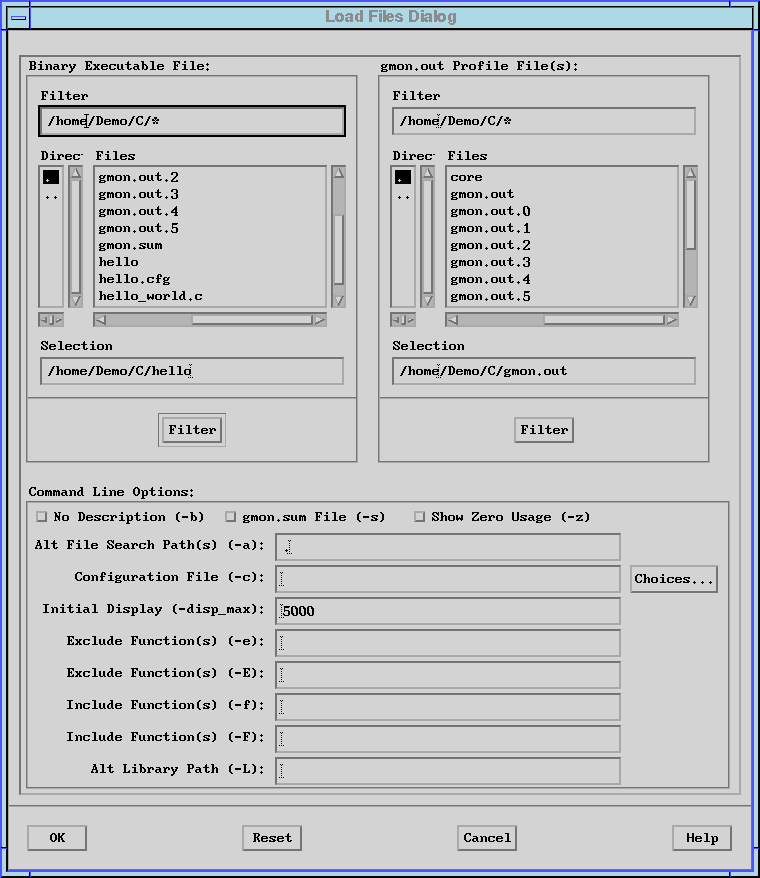
Select the File menu, and then the Load File option. The Load Files Dialog window appears.
Figure 2. Load Files Dialog Window
 View figure.
The Load Files Dialog window lets you specify your application's executable, and its corresponding profile data (gmon.out) files. When you load a file, you can also specify the various command line options that let you control the way Xprofiler displays the profiled data.
To load the files for the application you wish to profile, you need to specify the:
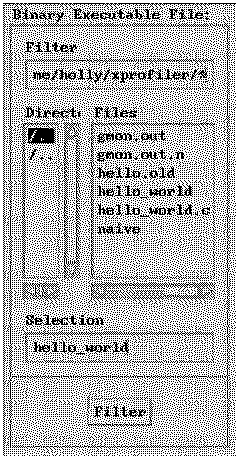
You specify the binary executable from the Binary Executable File of the Load Files Dialog window. The Binary Executable File area looks similar to this:
Figure 3. Binary Executable File Area
 View figure.
Use the scroll bars of the Directories and Files selection boxes to locate the executable file you wish to load. By default, all the files in the directory from which you invoked Xprofiler appear in the Files selection box. To select a file, click on it with the left mouse button.
To make locating your binary executable files easier, the Binary Executable File area includes a Filter button. Filtering lets you limit the files that are displayed in the Files selection box to those of a specific directory or of a specific type. For information on using the Filter, see "Using the Dialog Window Filters".
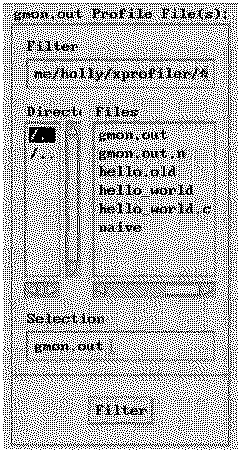
You specify the profile data file(s) from the gmon.out Profile Data File(s) area of the Load Files Dialog window. The gmon.out Profile Data File(s) area looks similar to this:
Figure 4. gmon.out Profile Data File(s) Area
 View figure.
When you started Xprofiler, with the xprofiler command, you were not required to indicate the name of the profile data file (which is probably why you are specifying it from the GUI). If you did not specify a profile data file, Xprofiler searches your directory for the presence of a file named gmon.out and, if found, places it in the Selection field of the gmon.out Profile File(s) area, as the default. Xprofiler then uses this file as input, even if it is not related to the binary executable file you specify. Since this will cause Xprofiler to display incorrect data, it is important that you enter the correct file into this field. So, if the profile data file you wish to use is named something other than what appears in the Selection field, you must replace it with the correct file name, as follows.
Use the scroll bars of the Directories and Files selection boxes to locate one or more of the profile data (gmon.out) files you wish to specify. The file you use does not have to be named gmon.out, and you may specify more than one profile data file. To select a file, click on it with the left mouse button. You can select multiple files by holding down the <Ctrl> key and clicking on each one with the left mouse button. To select multiple consecutive files, press and hold the left mouse button over the first file, and then drag the mouse over the other files. To de-select a file, press and hold the <Ctrl> key while clicking on the file.
To make locating your output files easier, the gmon.out Profile File(s) area includes a Filter button. Filtering lets you limit the files that get displayed in the Files selection box to those in a specific directory or of a specific type. For information on using the Filter, see "Using the Dialog Window Filters".
You specify command line options from the Command Line Options area of the Load Files Dialog window. The Command Line Options area looks similar to this:
Figure 5. Command Line Options Area
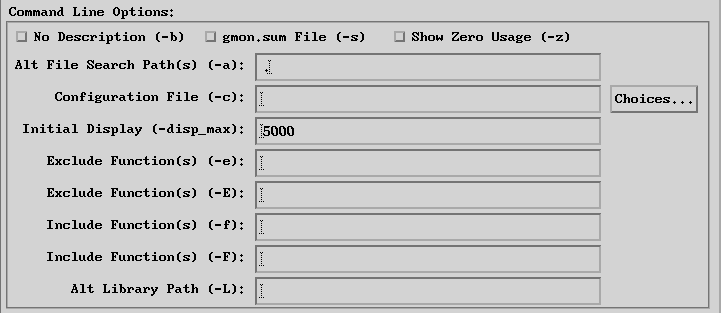 View figure.
You may specify one or more options as follows:
Table 2. Xprofiler GUI Command Line Options
| Use this flag: | To: | For example: |
|---|---|---|
| -b (button) | Suppresses the printing of the field descriptions for the Flat Profile, Call Graph Profile, and Function Index reports when they are written to a file with the Save As option of the File menu. | To suppress printing of the field descriptions for the Flat Profile, Call Graph Profile, and Function Index reports in the saved file, set the -b button to the pressed-in position. |
| -s (button) | If multiple gmon.out files are specified in the gmon.out Profile File(s) area, produces the gmon.sum profile data file. The gmon.sum file represents the sum of the profile information in all the specified profile files. Note that if you specify a single gmon.out file, the gmon.sum file contains the same data as the gmon.out file. | To write the sum of the data from three profile data files, gmon.out.1, gmon.out.2, and gmon.out.3, into a file called gmon.sum, set the -s button to the pressed-in position to activate this option. |
| -z (button) | Includes functions that have both zero CPU usage and no call counts in the Flat Profile, Call Graph Profile, and Function Index reports. A function will not have a call count if the file that contains its definition was not compiled with the -pg option, which is common with system library files. | To include all functions used by the application, in the Flat Profile, Call Graph Profile, and Function Index reports, that have zero CPU usage and no call counts, set the -z button to the pressed-in position to activate this option. |
| -a (field) | Adds alternative paths to search for source code and library files, or
changes the current path search order. After clicking on the
OK button, any modifications to this field are also made to the
Enter Alt File Search Paths: field of the Alt File
Search Path Dialog window. If both the Load Files
Dialog window and the Alt File Search Path Dialog window are opened at
the same time, when you make path changes in the Alt File Search Path Dialog
and click the OK button, these changes are also made to the Load
Files Dialog window. Also, when both of these windows are open
concurrently, clicking on the OK or Cancel buttons in the
Load Files Dialog causes both windows to close. If you wish to restore
the Alt File Search Path(s) (-a): field to the same state as
when the Load Files Dialog window was opened, click on the Reset
button.
You can use the "at" symbol (@) with this option to represent the default file path, in order to specify that other paths be searched before the default path. | To set the alternative file search path(s) so that Xprofiler searches pathA, the default path, then pathB, type pathA:@:pathB in the Alt File Search Path(s) (-a) field. |
| -c (field) | Loads the specified configuration file. If the -c option was used on the command line, or a configuration file had been previously loaded with the Load Files Dialog or Load Configuration File Dialog windows, the name of the most recently loaded file will appear in the Configuration File (-c): text field in the Load Files Dialog, as well as the Selection field of the Load Configuration File Dialog. If both the Load Files Dialog and Load Configuration File Dialog windows are open at the same time, when you specify a configuration file in the Load Configuration File Dialog and then click the OK button, the name of the specified file also appears in the Load Files Dialog. Also, when both of these windows are open concurrently, clicking on the OK or Cancel buttons in the Load Files Dialog causes both windows to close. When entries are made to both the Configuration File (-c): and Initial Display (-disp_max): fields in the Load Files Dialog, the value in the Initial Display (-disp_max): field is ignored, but is retained the next time this window is opened. If you wish to retrieve the file name that was in the Configuration File (-c): field when the Load Files Dialog window was opened, click on the Reset button. | To load the configuration file, type gmon.out in the Configuration File (-c) field. |
| -disp_max (field) | Sets the number of function boxes that Xprofiler initially displays in the function call tree. The value supplied with this flag can be any integer between 0 and 5,000. Xprofiler displays the function boxes for the most CPU-intensive functions through the number you specify. For instance, if you specify 50, Xprofiler displays the function boxes for the 50 functions in your program that consume the most CPU. After this, you can change the number of function boxes that are displayed via the Filter menu options. This flag has no effect on the content of any of the Xprofiler reports. | To display the function boxes for only 50 most CPU-intensive functions in the function call tree, type 50 in the Init Display (-disp_max) field |
| -e (field) | De-emphasizes the general appearance of the function box(es) for the
specified function(s) in the function call tree, and limits the number of
entries for these function in the Call Graph Profile report. This also
applies to the specified function's descendants, as long as they have not
been called by non-specified functions.
In the function call tree, the function box(es) for the specified function(s) appears greyed-out. Its size and the content of the label remain the same. This also applies to descendant functions, as long as they have not been called by non-specified functions. In the Call Graph Profile report, an entry for the specified function only appears where it is a child of another function, or as a parent of a function that also has at least one non-specified function as its parent. The information for this entry remains unchanged. Entries for descendants of the specified function do not appear unless they have been called by at least one non-specified function in the program. | To de-emphasize the appearance of the function boxes for foo
and bar, as well as their qualifying descendants in the function
call tree, and limit their entries in the Call Graph Profile report, type
foo and bar in the Exclude Routines (-e)
field.
You specify multiple functions by separating each one with a space. |
| -E (field) | Changes the general appearance and label information of the function
box(es) for the specified function(s) in the function call tree. Also
limits the number of entries for these functions in the Call Graph Profile
report, and changes the CPU data associated with them. These results
also apply to the specified function's descendants, as long as they have
not been called by non-specified functions in the program.
In the function call tree, the function box for the specified function appears greyed-out, and its size and shape also changes so that it appears as a square of the smallest allowable size. In addition, the CPU time shown in the function box label, appears as 0 (zero). The same applies to function boxes for descendant functions, as long as they have not been called by non-specified functions. This option also causes the CPU time spent by the specified function to be deducted from the left side CPU total in the label of the function box for each of the specified function's ancestors. In the Call Graph Profile report, an entry for the specified function only appears where it is a child of another function, or as a parent of a function that also has at least one non-specified function as its parent. When this is the case, the time in the self and descendants columns for this entry is set to 0 (zero). In addition, the amount of time that was in the descendants column for the specified function is subtracted from the time listed under the descendants column for the profiled function. As a result, be aware that the value listed in the % time column for most profiled functions in this report will change. | To change the display and label information for foo and
bar, as well as their qualifying descendants in the function call
tree, and limit their entries and data in the Call Graph Profile report, type
foo and bar in the Exclude Routines (-E)
field.
You specify multiple functions by separating each one with a space. |
| -f (field) | De-emphasizes the general appearance of all function boxes in the
function call tree, except for that of the specified function(s)
and its descendant(s). In addition, the number of entries in the Call
Graph Profile report for the non-specified functions and non-descendant
functions is limited. The -f flag overrides the
-e flag.
In the function call tree, all function boxes except for that of the specified function(s) and its descendant(s) appear greyed-out. The size of these boxes and the content of their labels remain the same. For the specified function(s), and its descendants, the appearance of the function boxes and labels remain the same. In the Call Graph Profile report, an entry for a non-specified or non-descendant function only appears where it is a parent or child of a specified function or one of its descendants. All information for this entry remains the same. | To de-emphasize the display of function boxes for all functions in the
function call tree except for foo, bar, and
their descendants, and limit their types if entries in the Call Graph Profile
report, type foo and bar in the Include Routines
(-f) field.
You specify multiple functions by separating each one with a space. |
| -F (field) | Changes the general appearance and label information of all function
boxes in the function call tree except for that of the specified
function(s) and its descendants. In addition, the number of entries in
the Call Graph Profile report for the non-specified and non-descendant
functions is limited, and the CPU data associated with them is changed.
The -F flag overrides the -E flag.
In the function call tree, all function boxes except for that of the specified function(s) and its descendant(s) appear greyed-out. The size and shape of these boxes changes so that they appear as squares of the smallest allowable size. In addition, the CPU time shown in the function box label, appears as 0 (zero). In the Call Graph Profile report, an entry for a non-specified or non-descendant function only appears where it is a parent or child of a specified function or one of its descendants. When this is the case, the time in the self and descendants columns for this entry is set to 0 (zero). As a result, be aware that the value listed in the % time column for most profiled functions in this report will change. | To change the display and label information of the function boxes for all
functions except the functions foo and bar
and their descendants, and limit their types of entries and data in the Call
Graph Profile, type foo and bar in the Include
Routines (-F) field.
You specify multiple functions by separating each one with a space. |
| -L (field) | Sets the alternate pathname for locating shared objects. If you plan to specify multiple paths, use the Set File Search Path option of the File menu on the Xprofiler GUI. See "Setting the File Search Sequence" for information. | Type the alternate library pathname in this field. |
Once you have specified the binary executable, the profile data file, and any command line options you wish to use, press the OK button to save the changes and close the dialog window. Xprofiler loads your application and displays its performance data.
You can specify where you want Xprofiler to look for your library files and source code files by using the Set File Search Paths option of the File menu. By default, Xprofiler searches the default paths first and then any alternative paths you specify.
For library files, Xprofiler uses the paths recorded in the specified gmon.out file(s). If you use the -L command line option, the path you specify with this option will be used instead of those in the gmon.out file.
| Note: | -L allows only one path to be specified and you can use this option only once. |
For source code files, the paths recorded in the specified a.out file are used.
These are the paths you specify with the Set File Search Paths option of the File menu.
For library files, if everything else failed, the search will be extended to the path(s) specified in the LIBPATH environment variable.
To specify alternative path(s), do the following:
Notes:
You can change the order of the search sequence for library files and source code files via the Set File Search Paths option of the File menu. To change the search sequence, do the following:
To return the search sequence back to its default order, repeat steps 1 through 3, but in step 2 above, click on the Check default path(s) first button. When the action is confirmed (by clicking on the OK button), the search sequence will start with the default paths again.
Keep in mind that if a file is found in one of the alternative paths or a path in LIBPATH, this path now becomes the default path for this file throughout the current Xprofiler session (until you exit this Xprofiler session or load a new set of data).
The primary difference between Xprofiler and the UNIX gprof command is that Xprofiler gives you a graphical picture of your application's CPU consumption in addition to textual data. This allows you to focus quickly on the areas of your application that consume a disproportionate amount of CPU.
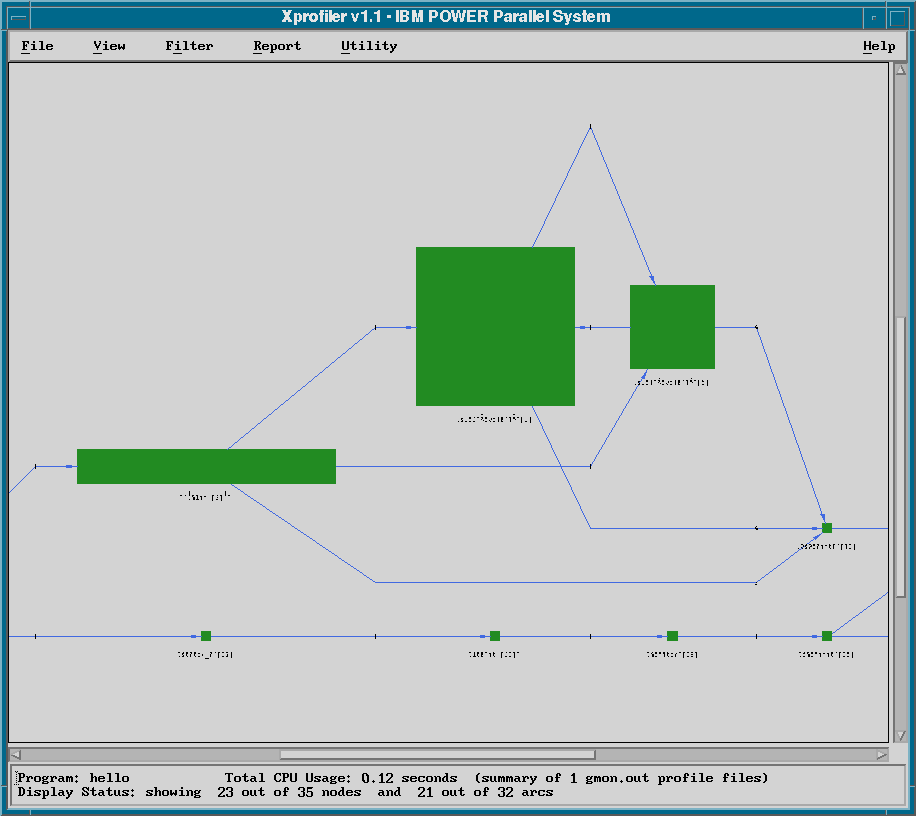
Xprofiler displays your profiled program in a single main window. It uses several types of graphic images to represent the relevant parts of your program. Functions appear as solid green boxes (called function boxes), and the calls between them appear as blue arrows (called call arcs). The function boxes and call arcs that belong to each library within your application appear within a fenced-in area called a cluster box. The way that functions, calls, and library clusters are depicted is discussed later.
The Xprofiler main window contains a graphical representation of the functions and calls within your application as well as their inter-relationships. It provides six menus, including one for online help.
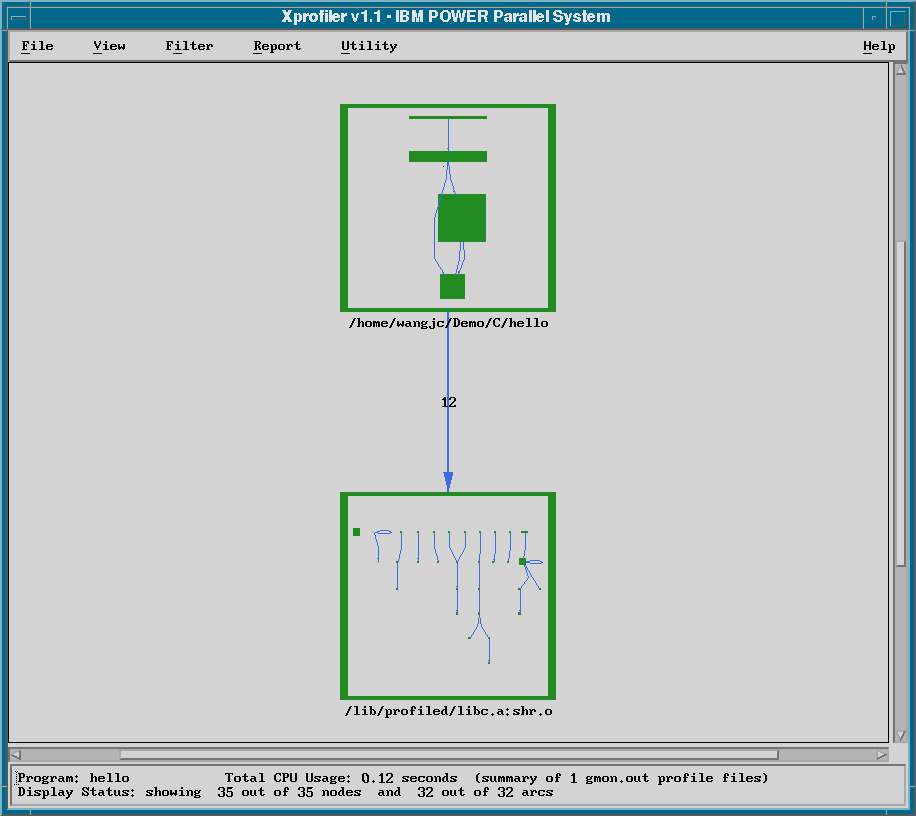
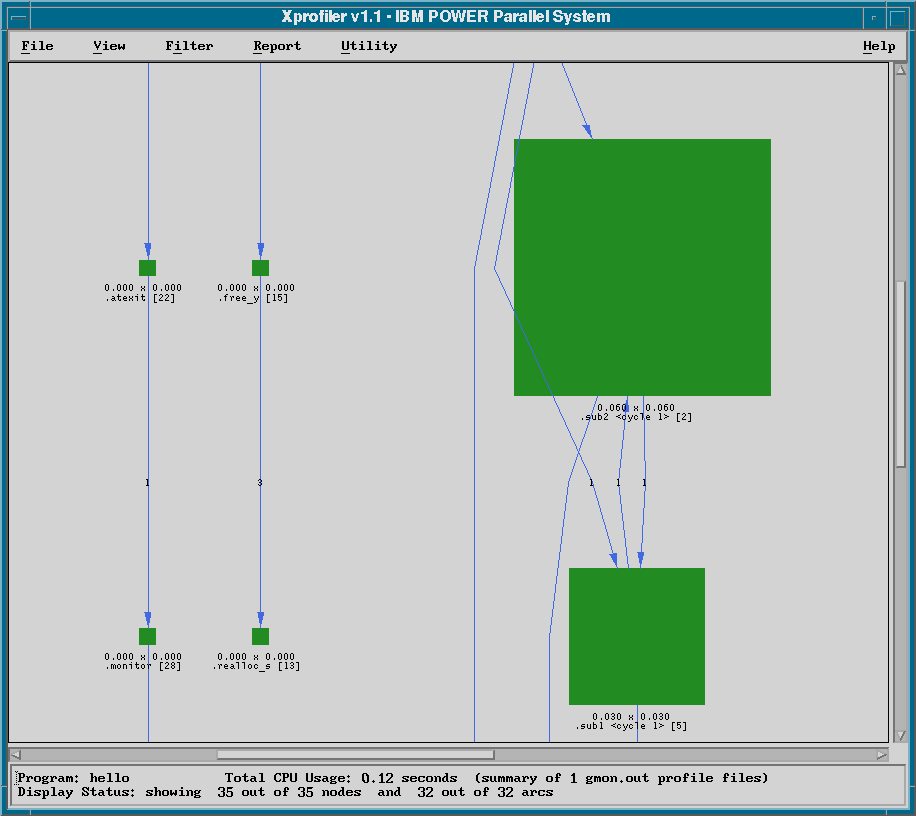
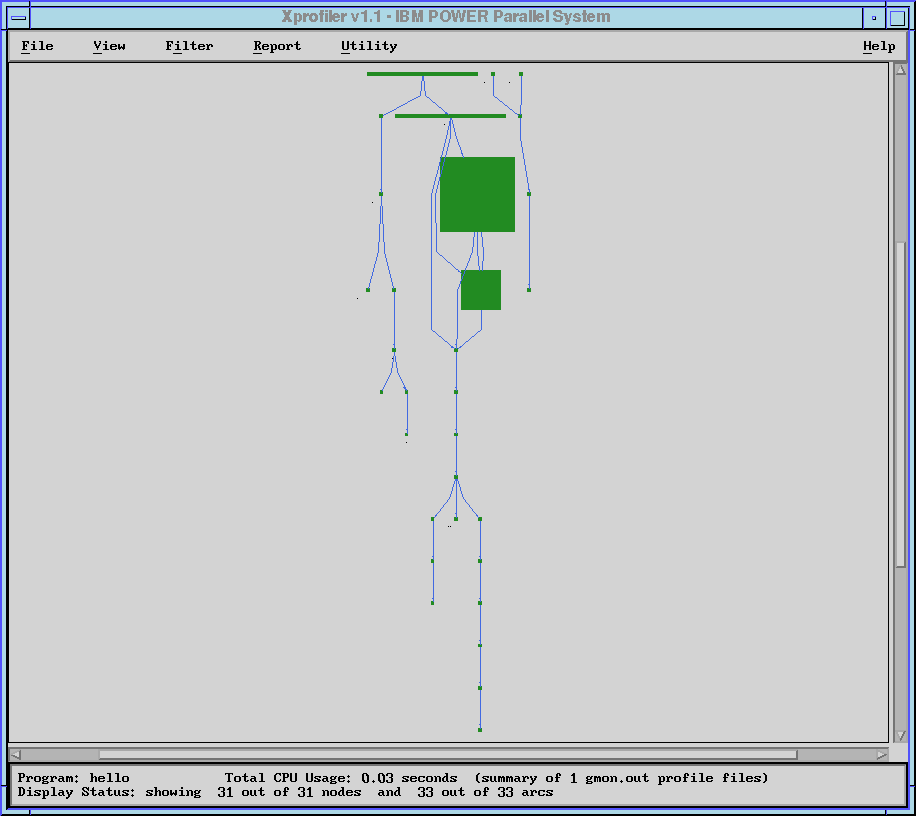
The Xprofiler main window looks similar to this when an application has been loaded:
Figure 6. Sample Xprofiler Main Window
 View figure.
In the main window, Xprofiler displays the function call tree. The function call tree displays the function boxes, arcs, and cluster boxes that represent the functions within your application.
| Note: | When Xprofiler first opens, by default, the function boxes for your application will be clustered by library, as in the example above. This means that a cluster box appears around each library, and the function boxes and arcs within the cluster box are reduced in size. If you wish to see more detail, you need to uncluster the functions. To do this, select the File menu and then the Uncluster Functions option. |
Along the upper portion of the main window is the menu bar. The left side of the menu bar contains the Xprofiler menus that let you work with your profiled data. On the right side of the menu bar, there is a Help menu for accessing online help.
The Xprofiler menus are described below:
The File menu lets you specify the executable (a.out) files and profile data (gmon.out) files that Xprofiler will use. It also lets you control how your files are accessed and saved.
The View menu lets you focus on specific portions of the function call tree in order to get a better view of the application's critical areas.
The Filter menu lets you add, remove, and change specific parts of the function call tree. By controlling what Xprofiler displays, you can focus on the objects that are most important to you.
The Report menu provides several types of profiled data in a textual and tabular format. In addition to presenting the profiled data, the options of the Report menu let you:
The Utility menu contains one option; Locate Function By Name, which lets you highlight a particular function in the function call tree.
The Function menu lets you perform a number of operations for any of the functions shown in the function call tree. You can access statistical data, look at source code, and control which functions get displayed.
The Function menu is not visible from the Xprofiler window. You access it by clicking on the function box of the function in which you are interested with your right mouse button. By doing this, you not only bring up the Function menu, but you select this function as well. Then, when you select actions from the Function menu, they are applied to this function.
The Arc menu lets you locate the caller and callee functions for a particular call arc. A call arc is the representation of a call between two functions within the function call tree.
The Arc menu is not visible from the Xprofiler window. You access it by clicking on the call arc in which you are interested with your right mouse button. By doing this, you not only bring up the Arc menu, but you select that call arc as well. Then, when you perform actions with the Arc menu, they are applied to that call arc.
The Cluster Node menu lets you control the way your libraries are displayed by Xprofiler. In order to access the Cluster Node Menu, the function boxes, in the function call tree, must first be clustered by library. See "Clustering Libraries Together" for information about clustering and unclustering the function boxes of your application. When the function call tree is clustered, all the function boxes within each library appear within a cluster box.
The Cluster Node menu is not visible from the Xprofiler window. You access it by clicking on the edge of the cluster box in which you are interested with your right mouse button. By doing this, you not only bring up the Cluster Node menu, but you select that cluster as well. Then, when you perform actions with the Cluster Node menu, they are applied to the functions within that library cluster.
At the bottom of the Xprofiler window is a single field that tells you:
Functions are represented by green, solid-filled boxes in the function call tree. The size and shape of each function box indicates its CPU usage. The height of each function box represents the amount of CPU time it spent on executing itself. The width of each function box represents the amount of CPU time it spent executing itself, plus its descendant functions.
This type of representation is known as summary mode. In summary mode, the size and shape of each function box is determined by the total CPU time of multiple gmon.out files used on that function alone, and the total time used by the function and its descendant functions. A function box that is wide and flat represents a function that uses a relatively small amount of CPU on itself (it spends most of its time on its descendants). On the other hand, the function box for a function that spends most of its time executing only itself will be roughly square-shaped.
Functions can also be represented in average mode. In average mode, the size and shape of each function box is determined by the average CPU time used on that function alone, among all loaded gmon.out files, and the standard deviation of CPU time for that function among all loaded gmon.out files. The height of each function node represents the average CPU time, among all the input gmon.out files, used on the function itself. The width of each node represents the standard deviation of CPU time, among the gmon.out files, used on the function itself. The average mode representation is available only when more than one gmon.out file is entered. For more information on summary mode and average mode, see "Controlling the Representation of the Function Call Tree".
Under each function box in the function call tree is a label that contains the name of the function and related CPU usage data. For information on the function box labels, see "Getting Basic Data".
The example below shows the function boxes for two functions, sub1 and printf, as they would appear in the Xprofiler display.
Figure 7. Example of Function Boxes and Arcs in Xprofiler Display
 View figure.
Each function box has its own menu. To access it, place your mouse cursor over the function box of the function in which you are interested, and press the right mouse button. Each function also has an information box that lets you get basic performance numbers quickly. To access the information box, place your mouse cursor over the function box of the function in which you are interested, and press the left mouse button.
The calls made between each of the functions in the function call tree are represented by blue arrows extending between their corresponding function boxes. These lines are called call arcs. Each call arc appears as a solid blue line between two functions. The arrowhead indicates the direction of the call; the function represented by the function box it points to is the one that receives the call. The function making the call is known as the caller, while the function receiving the call is known as the callee.
Each call arc includes a numerical label that tells you how many calls were exchanged between the two corresponding functions.
Figure 7, above, shows several call arcs. For the call arc that connects sub1 and printf, sub1 is the caller and printf is the callee. The label tells you that sub1 called printf four times.
Note that each call arc has its own menu that lets you locate the function boxes for its caller and callee functions. To access it, place your mouse cursor over the call arc for the call in which you are interested, and press the right mouse button. Each call arc also has an information box that shows you the number of times the caller function called the callee function. To access the information box, place your mouse cursor over the call arc for the call in which you are interested, and press the left mouse button.
Xprofiler lets you collect the function boxes and call arcs that belong to each of your shared libraries into cluster boxes. Figure 6 shows an example of an Xprofiler display in which the libraries are clustered.
Since there will be a box around each library, the individual function boxes and call arcs will be difficult to see. If you want to see more detail, you will need to uncluster the function boxes. To do this, select the Filter menu and then the Uncluster Functions option.
When viewing function boxes within a cluster box, note that the size of each function box is relative to those of the other functions within the same library cluster. On the other hand, when all the libraries are unclustered, the size of each function box is relative to all the functions in the application (as shown in the function call tree).
Each library cluster has its own menu that lets you manipulate the cluster box. To access it, place your mouse cursor over the edge of the cluster box you are interested in, and press the right mouse button. Each cluster also has an information box that shows you the name of the library and the total CPU usage (in seconds) consumed by the functions within it. To access the information box, place your mouse cursor over the edge of the cluster box you are interested in and press the left mouse button.
The Xprofiler graphical user interface (GUI) contains features and buttons that are common throughout the interface. This section explains how to use some of these common elements.
The buttons that appear on the Xprofiler dialog windows are explained below:
Saves the changes, executes the action, and closes the dialog window.
Saves the changes, executes the action, but leaves the dialog window open.
Restores the fields of the dialog window to their original values (at the time you opened it), and keeps the dialog window open.
Ignores changes and closes the dialog window.
Brings up the Xprofiler online help.
Executes filtering criteria provided by you in the dialog window.
Some of the Xprofiler windows that are accessible via the Report and Function menus provide a Search Engine field that lets you search for a specific string. In the Search Engine field, which is located at the bottom of these windows, you type the string in which you are interested. The first row that contains the string you specified is highlighted.
To use the Search Engine to search for a string:
Extended regular expressions are allowed. For more information, see the explanation of the regcmp and regcomp commands in AIX Technical Reference, Volume 2: Base Operating System and Extensions (SC23-2615).
A Save dialog window appears when you choose the Save As option from any of the Xprofiler reports windows or from the File Menu. It allows you to save the data you see, in the report window that is currently open, to a file.
| Note: | If you choose the Save As option from one of the reports windows, the title of the dialog window included the name of the report (for example Save Flat Profile). |
To save the current report data to a file using the Save dialog window:
Many of the Xprofiler dialog windows include a Filter button. The use of the Xprofiler Filter function follows the Motif standard. To use the Filter:
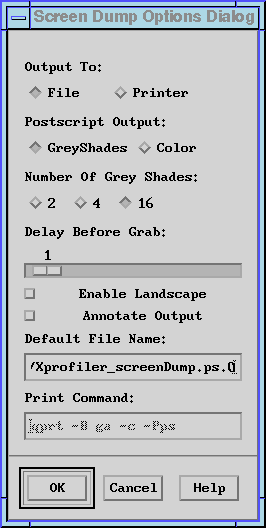
Many of the dialog windows include buttons and sliders that allow you to select options and specify values.
Aside from push-buttons, the Xprofiler dialog windows also use radio buttons and toggle buttons. Radio buttons let you select one item from a set of items, while toggle buttons let you activate or de-activate a single item.
In the example below, the Screen Dump Options Dialog window uses both radio buttons and toggle buttons. For instance, under Output To, there are two radio buttons; File and Printer. You must select one or the other, but you cannot select both. Just above the Default Directory field, notice two toggle buttons; Enable Landscape and Annotate Output. By using the toggle buttons, you can activate either one or both of these options.
To select (or activate) an option with a radio or toggle button, set the button to the pressed-in position by by clicking on it. When a button is pressed-in, it appears shaded. Under Output To, in the example below, File is selected and Printer is not.
Figure 8. Example Showing Radio Buttons, Toggle Buttons, and Slider
 View figure.
Several of the Xprofiler dialog windows include sliders that let you specify a numerical value. In the example above, the Delay Before Grab slider lets you specify the number of seconds you want to pass before the screen image is actually captured.
Place your mouse cursor over the slider. Press and hold the left mouse button while moving the slider horizontally in either direction. The number above the slider changes as you move it, and indicates the number selected. Once the slider is at the setting you want, release the mouse button.
If the number of selectable values on the slider is high, you may want to have finer control over the placement of the slider. If so, click on the slider and then use the arrow keys on your keyboard to place it.
Xprofiler lets you look at your profiled data a number of ways, depending on what you want to see. It provides:
Xprofiler lets you magnify specific areas of the window to get a better view of your profiled data. The View menu includes three options that let you do this:
To resize a specific area of the display, you can use either the Overview or Zoom In options of the View menu. To magnify an area with the Overview option:
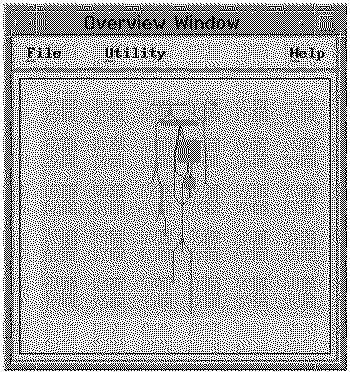
Figure 9. The Overview Window
 View figure.
The Overview Window contains a miniature view of the function call tree, just as it appears in the Xprofiler main display. When you open the Overview Window, the light blue highlight area represents the current view of the main window.
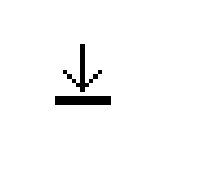
You control the size and placement of the highlight area with your mouse. Depending on where you place your mouse over the highlight area, your cursor changes to indicate the operation you can perform. Here is an explanation of the cursor images, and what they indicate to you:
When your cursor appears as two crossed arrows, it means that by pressing and holding your mouse button, you can control where the box is placed.
Figure 10. Cursor when movement of highlight box is under mouse control
 View figure.
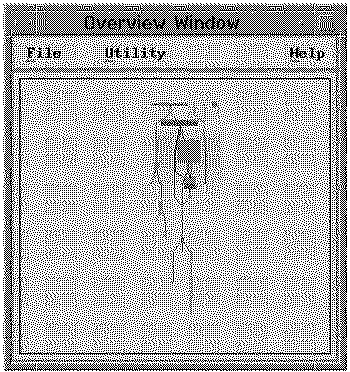
When your cursor appears as a line with an arrow perpendicular to it, it means that your mouse button has grabbed the edge of the highlight area, and you now have the ability to resize it. By pressing and holding your mouse button, and dragging it in or out, you can increase or decrease the size of the box. Notice that as you move the edge in or out, the size of the entire highlight area changes.
Figure 11. Cursor when edge of highlight box is under mouse control
 View figure.
When your cursor appears as a right angle with an arrow pointing into it, it means that your mouse button has grabbed the corner of the highlight area and you now have the ability to resize it. By pressing and holding your mouse button, and dragging it diagonally up or down, you can increase or decrease the size of the box. Notice that as you move the corner up or down, the size of the entire highlight area changes.
Figure 12. Cursor when corner of highlight box is under mouse control
 View figure.
Figure 13. Highlight Area Reduced in Size
 View figure.
The example below shows the Xprofiler main display with the area, indicated by the highlight area in Figure 13, magnified. Note that the performance data, on the label of each function box, is now visible.
Figure 14. Magnified View of Xprofiler Display
 View figure.
To use the Zoom In option of the View menu to magnify a specific area of the function call tree:
To get an even closer view of the area you selected, choose the Zoom In option again and follow the steps above.
There may be times when you are looking at the function call tree too closely. The Zoom Out option lets you widen the view of the function call tree, as if you were taking a few steps back from a painting on a wall.
The Zoom Out option is most useful after using the Zoom In or Overview options to magnify an area of the function call tree. By default, the Xprofiler main window is completely zoomed out (it shows you the entire function call tree). The Zoom Out option helps you return the main window to this state.
To zoom out:
To further step back from the area you selected, choose the Zoom Out option again, and follow the steps above.
The Utility menu of the Overview window lets you choose the mode in which the display is updated. The default is the Immediate Update option, which causes the display to show you the items in the highlight area as you are moving it around. The Delayed Update option, on the other hand, causes the display to be updated only when you have moved the highlight area over the area in which you are interested, and released the mouse button. The Immediate Update option only applies to what you see when you move the highlight area; it has no effect on the resizing of items in highlight area, which is always delayed.
Xprofiler lets you change the way it displays the function call tree, based on your own personal preferences.
You can choose between 2-D and 3-D function boxes in the function call tree. The default style is 2-D, but you can change this to 3-D. To do this:
You can choose to have Xprofiler display the function call tree in either Top-to-Bottom or Left-to-Right format. The default is Top-to-Bottom. If you would rather see the function call tree displayed in Left-to-Right format:
Figure 15. Left-to-Right Format
 View figure.
You can choose to have Xprofiler represent the function call tree in either summary mode or average mode.
When you select the Summary Mode option of the View menu, the size and shape of each function box is determined by the total CPU time of multiple gmon.out files used on that function alone, and the total time used by the function and its descendant functions. The height of each function node represents the total CPU time used on the function itself. The width of each node represents the total CPU time used on the function and its descendant functions. When the display is in summary mode, the Summary Mode option is greyed out and the Average Mode option is activated.
When you select the Average Mode option of the View menu, the size and shape of each function box is determined by the average CPU time used on that function alone, among all loaded gmon.out files, and the standard deviation of CPU time for that function among all loaded gmon.out files. The height of each function node represents the average CPU time, among all the input gmon.out files, used on the function itself. The width of each node represents the standard deviation of CPU time, among the gmon.out files, used on the function itself.
The purpose of average mode is to reveal workload balancing problems when an application is involved with multiple gmon.out files. In general, a function node with large standard deviation has a wide width, and a node with small stadard deviation has a slim width.
| Note: | Both summary mode and average mode only affect the appearance of the function call tree and the labels associated with it. All the performance data in Xprofiler reports and code displays are always summary data. If only one gmon.out file is given, both Summary Mode and Average Mode will be greyed out, and the display is always in Summary Mode. |
When Xprofiler first opens, the entire function call tree appears in the main window. This includes the function boxes and call arcs that belong to your executable as well as the shared libraries that it utilizes. At times, you may want to simplify what you see in the main window, and there are a number of ways to do this.
| Note: | Filtering options of the Filter menu let you change the appearance of the function call tree only. The performance data contained in the reports (via the Reports menu) is not affected. |
Xprofiler allows you to undo operations that involve adding or removing nodes and arcs from the function call tree. When you undo an operation, you reverse the effect of any operation which adds or removes function boxes or call arcs to the function call tree. When you select the Undo option, the function call tree is returned to its appearance just prior to the performance of the add or remove operation. To undo an operation:
Whenever you invoke the Undo option, the function call tree loses its zoom focus and zooms all the way out to reveal the entire function call tree in the main display. When you start Xprofiler, the Undo option is greyed out. It is activated only after an add or remove operation involving the function call tree takes place. After you undo an operation, the option greys out again until the next add or remove operation takes place.
The options that activate the Undo option include:
If a dialog, like the Load Configuration Dialog or the Filter by CPU Time Dialog, is invoked and then cancelled immediately, the status of the Undo option is not affected. Once the option is available, it stays that way until you invoke it, or a new set of files is loaded into Xprofiler through the Load Files Dialog.
When you first open Xprofiler, by default, all the function boxes and call arcs of your executable and its shared libraries appear in the main window. After that, you may choose to filter out specific items from the window. However, there may be times when you want to see the entire function call tree again, without having to reload your application. To do this:
There are a number of ways that Xprofiler lets you control the items that get displayed in the main window. For the most part, you will want to include or exclude certain objects so that you can more easily focus on the things that are of most interest to you.
In most cases, your application will call functions that are within shared libraries. By default, these shared libraries will appear in the Xprofiler window along with your executable. As a result, the window may get crowded and obscure the items that you really want to see. If this is the case, you may want to filter the shared libraries from the display. To do this:
The shared library function boxes disappear from the function call tree, leaving only the function boxes of your executable file visible.
If you removed the library calls from the display, you may want to add all or some of them back. To do this:
The function boxes once again appear with the function call tree. Note, however, that all of the shared library calls that were in the initial function call tree may not be added back. This is because the Add Library Calls option only adds back in the function boxes for the library functions that were called by functions that are currently displayed in the Xprofiler window.
There may be times when you want to add only specific function boxes back into the display. To do this:
If there are multiple functions in your program that include the string you enter in their names, the filter applies to each one. For example, say you specified sub, and print, and your program also included functions named sub1, psub1 and printf. The sub, sub1, psub1, print, and printf functions would all be added to the graph.
The Filter menu of Xprofiler offers you three options that allow you to add or subtract function boxes from the main window, based on specific characteristics. The options are:
Each one of these options uses a different dialog window to let you specify the criteria by which you want to include or exclude function boxes from the window.
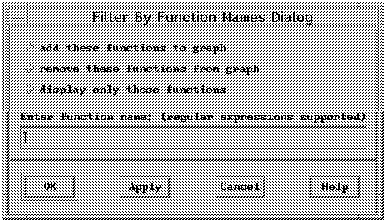
To filter by function names:
Figure 16. Filter By Function Names Dialog window
 View figure.
From the Filter By Function Names Dialog window, select the option you want, and then type the name of the function(s) to which you want it applied in the Enter function name field. For example, say you wanted to remove function box for a function called printf, from the main window. You would click on the remove this function from the graph button and type printf in the Enter function name field.
You can enter more than one function name in this field. If there are multiple functions in your program that include the string you enter in their names, the filter will apply to each one. For example, say you specified sub and print, and your program also included functions named sub1, psub1, and printf. The option you chose would be applied to the sub, sub1, psub1, print, and printf functions.
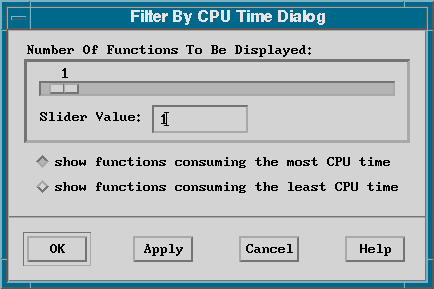
To filter by CPU time:
Figure 17. Filter By CPU Time Dialog window
 View figure.
For example, if you wanted to display the function boxes for the 10 functions in your application that consumed the most CPU, you would select the show functions consuming the most CPU button, and specify 10 with the slider or enter the value 10 in the text field.
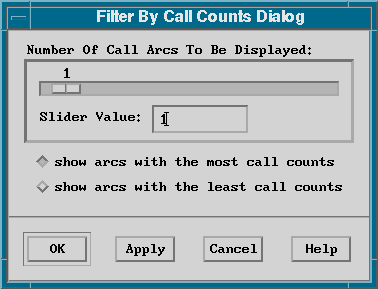
To filter by call counts:
Figure 18. Filter By Call Counts Dialog window
 View figure.
For example, if you wanted to display the 10 call arcs in your application that represented the least number of calls, you would select the show arcs with the least call counts button, and specify 10 with the slider or enter the value 10 in the text field.
When tuning the performance of your application, you will want to know which functions consumed the most CPU time, and then you will need to ask several questions in order to understand their behavior:
Once you understand how these functions behave, and are able to improve their performance, you can move on to analyzing the functions that consume less CPU.
When your application is large, the function call tree will also be large. As a result, the functions that are the most CPU-intensive may be difficult to see in the function call tree. To get around this, use the Filter by CPU option of the Filter menu, which lets you display only the function boxes for the functions that consume the most CPU time. Once you've done this, the Function menu for each function lets you add the parent and descendant function boxes to the function call tree. By doing this, you create a smaller, simpler function call tree that displays the function boxes associated with most CPU-intensive area of the application.
A child function is one that is directly called by the function of interest. To see only the function boxes for the function of interest and its child functions:
Xprofiler erases the current display and replaces it with only the function boxes for the function you chose, plus its child functions.
A parent function is one that directly calls the function of interest. To see only the function box for the function of interest and its parent functions:
Xprofiler erases the current display and replaces it with only the function boxes for the function you chose, plus its parent functions.
There may be times when you may want to see the function boxes for both the parent and child functions of the function in which you are interested, without erasing the rest of the function call tree. This is especially true if you chose to display the function boxes for two or more of the most CPU-intensive functions with the Filter by CPU option of the Filter menu (you suspect that more than one function is consuming too much CPU). To do this:
Xprofiler leaves the current display as it is, but adds the parent function boxes.
Xprofiler leaves the current display as it is, but now adds the child function boxes in addition to the parents.
When you first bring up the Xprofiler window, by default, the function boxes of your executable, and the libraries associated with it, are clustered. Since Xprofiler shrinks the call tree of each library when it places it in a cluster, you will need to uncluster the function boxes if you want to look closely at a specific function box label.
It is important to understand that you can see significantly more detail per function, when your display is in the unclustered or expanded state, than when it is in the clustered or collapsed state. So, depending on what you want to do, you will need to cluster or uncluster (collapse or expand) the display.
There may be times when the Xprofiler window is visually crowded. This is especially true if your application calls functions that are within shared libraries; function boxes representing your executable functions as well as the functions of the shared libraries get displayed. As a result, you may want to organize what you see in the Xprofiler window so you can focus on the areas that are most important to you. One way you can do this is to collect all the function boxes of each library into a single area, known as a library cluster.
When you choose to cluster your libraries, Xprofiler gathers all the functions for each one into a single area, and draws a green box around them. This is known as a cluster box. The name of the library also appears below the box.
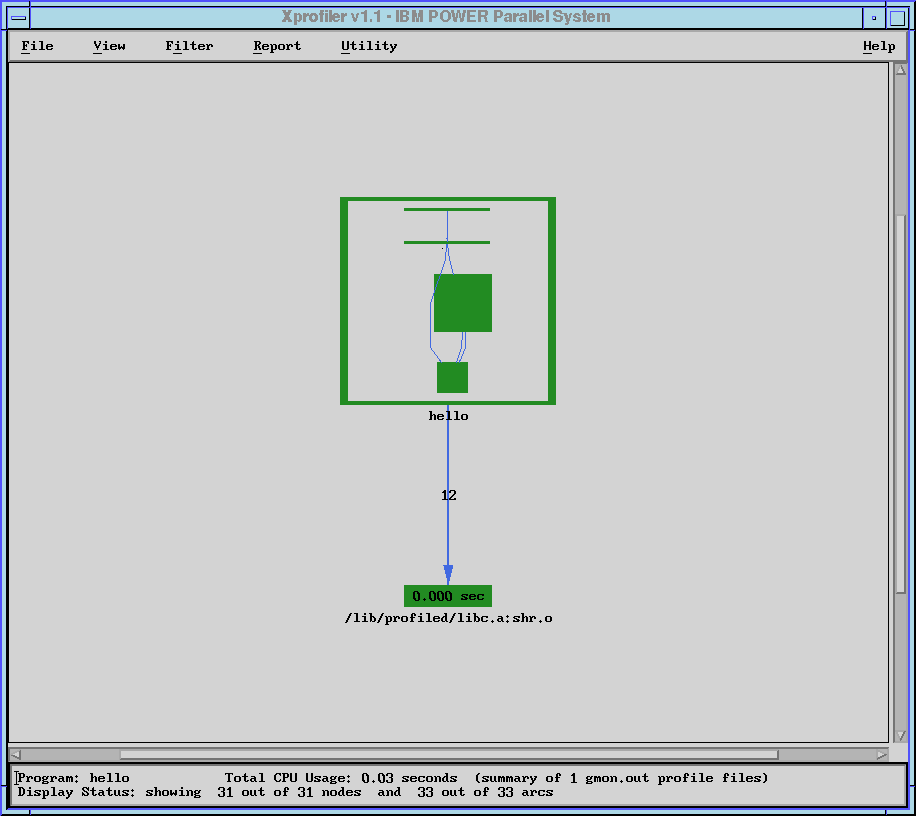
The function boxes in the application shown in Figure 6 have been clustered. Note that one cluster box holds the function boxes associated with the executable hello_world, while the other cluster box holds the function boxes of the shared library /lib/profiled/libc.a:shr.o.
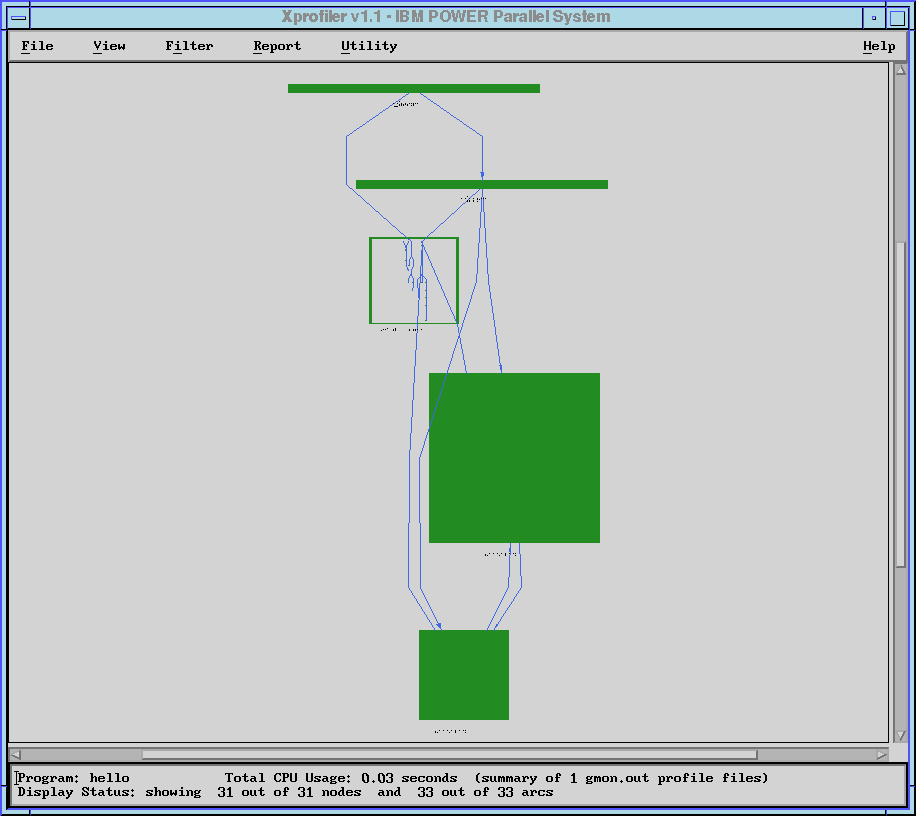
The example below shows the same application, hello_world, with its function boxes unclustered. Now that the function boxes of your executable and its shared libraries are displayed together, which means their relationships are more apparent.
Figure 19. Xprofiler Window with Function Boxes Unclustered
 View figure.
If the functions within your application are unclustered, you can use an option of the Filter menu to cluster them.
Once you cluster the functions in your application, as shown in Figure 6, you can further reduce the size (also referred to as collapse) of each cluster box. To do this:
Figure 20. Xprofiler Window with One Library Cluster Box Collapsed
 View figure.
To return the cluster box to its original condition (expand it):
If the functions within your application are clustered, you can use an option of the Filter menu to uncluster them.
If your functions have been clustered, you may want to remove one or more (but not all) cluster boxes. For example, say you wanted to uncluster only the functions of your executable, but keep its shared libraries within their cluster boxes. You would:
The example below shows the executable, hello_world with its cluster box removed. Its shared library, /lib/profiled/libc.a:shr.o, remains within its cluster box.
Figure 21. Xprofiler Window with One Library Cluster Box Removed
 View figure.
If you are interested in one or more specific functions in a complex program, you may need help locating their corresponding function boxes in the function call tree.
If you would like to locate a single function, and you know its name, you can use the Locate Function By Name option of the Utility menu. To locate a function by name:
To display the function call tree in full detail again, go to the View menu and use the Overview option.
There may also be times when you want to see only the function boxes for the functions you are concerned with, plus other specific functions that are related to it. For instance, suppose you want to see all the functions that directly called the function in which you are interested. It might not be easy to pick out these function boxes when you view the entire call tree, so you would want to display them, plus the function of interest, alone.
Each function has its own menu, called a Function menu. Via the Function menu, you can choose to see the following for the function in which you are interested:
When you use these options, Xprofiler erases the current display and replaces it with only the function boxes for the function of interest and all the functions of the type you specified.
A parent is any function that directly calls the function in which you are interested. To locate the parent function boxes of the function in which you are interested:
A child is any function that is directly called by the function in which you are interested. To locate the child functions boxes for the function in which you are interested:
An ancestor is any function that can call, directly or indirectly, the function in which you are interested. To locate the ancestor functions:
A descendant is any function that can be called, directly or indirectly, by the function in which you are interested. To locate the descendant functions (all the functions that the function of interest can reach, directly or indirectly):
To locate the functions that are on the same cycle as the function you are interested in:
With Xprofiler, you can get performance data for your application on a number of levels, and in a number of ways. You can easily view data pertaining to a single function, or you can use the reports provided to get information on your application as a whole.
Xprofiler makes it easy to get data on specific items in the function call tree. Once you've located the item you are interested in, you can get data a number of ways. If you are having trouble locating a function in the function call tree, see "Locating Specific Objects in the Function Call Tree".
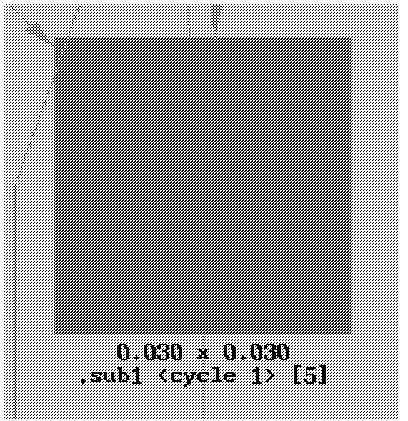
Below each function box in the function call tree is a label that contains basic performance data. The example below shows the function box for the function main, and it's label.
Figure 22. Example of a Function Box Label
 View figure.
The label contains the name of the function, its associated cycle, if any, and its index. In the example above, the name of the function is sub1. It is associated with cycle 1, and its index is 5. Also, depending on whether the function call tree is viewed in summary mode or average mode, the label will contain the information listed below. See "Controlling the Representation of the Function Call Tree" for more about summary mode and average mode.
Since labels are not always visible in the Xprofiler window when it is fully zoomed out, you may need to zoom in on it in order to see the labels. See "Zooming In on the Function Call Tree" for information on how to do this.
Call arc labels appear over each call arc. The label shows you the number of calls that were made between the two functions (from caller to callee). For example:
Figure 23. Example of a call arc label
 View figure.
In order to see a call arc label, you will probably need to zoom in on it. See "Zooming In on the Function Call Tree" for information on how to do this.
Cluster box labels tell you the name of the library that is represented by that cluster. If it is a shared library, the label shows its full pathname.
For each function box, call arc, and cluster box, there is a corresponding information box that you can access with your mouse. It gives you the same basic data that appears on the label. This is useful when the Xprofiler display is fully zoomed out and the labels are not visible. To access the information box, click on the function box, call arc, or cluster box (place it over the edge of the box) with the left mouse button. The information box appears.
For a function, the information box contains:
For a call, the information box contains:
For cluster, the information box contains:
You can get performance statistics for a single function via the Statistics Report option of the Function menu. It lets you see data on the CPU usage and call counts of the selected function. If you are using more than one gmon.out file, this option breaks down the statistics per each gmon.out file you use.
When you select the Statistics Report menu option, the Function Level Statistics Report window appears, as in the example below.
Figure 24. Function Level Statistics Report window
 View figure.
The Function Level Statistics Report window provides the following information:
The name of the function you selected. In Figure 24, the function name is main.
The total amount of CPU used by this function. If you used multiple gmon.out files, the value shown here represents their sum.
The CPU Usage field shows you:
In Figure 24, CPU usage is listed as 0.10 seconds (self+desc) x 0.10 seconds (self)
The Call Counts field shows you:
In Figure 24, the value in the Call Counts field is 1 times.
The CPU usage and calls made to or by this function, broken down by gmon.out file.
The CPU Usage field shows you:
The average CPU time used by the data in each gmon.out file. In Figure 24, the Average is listed as 0.0100 seconds.
Standard deviation. A value that represents the difference in CPU usage samplings, per function, from one gmon.out file to another. The smaller the standard deviation, the more balanced the workload. In Figure 24, the Std Dev is listed as 0.0000 seconds.
Of all the gmon.out files, the maximum amount of CPU time used. The corresponding gmon.out file appears to the right. In Figure 24, the Maximum is listed as 0.01 seconds.
Of all the gmon.out files, the minimum amount of CPU time used. The corresponding gmon.out file appears to the right. In Figure 24, the Minimum is listed as 0.01 seconds.
The Call Counts field shows you:
The average number of calls made to this function or by this function, per gmon.out file. In Figure 24, the Average is 1.00 times.
Standard deviation. A value that represents the difference in call count sampling, per function, from one gmon.out file to another. A small standard deviation value in this field means that the function was almost always called the same number of times in each gmon.out file. In Figure 24, the Std Dev is 0.00 times.
The maximum number of calls made to this function or by this function in a single gmon.out file. The corresponding gmon.out file appears to the right. In Figure 24, the Maximum is 1 times.
The minimum number of calls made to this function or by this function in a single gmon.out file. The corresponding gmon.out file appears to the right. In Figure 24, the Minimum is 1 times.
Xprofiler provides performance data in textual and tabular format. This data is provided in various tables called reports. If you are a gprof user, you are familiar with the Flat Profile, Call Graph Profile, and Function Index reports. Xprofiler generates these same reports, in the same format, plus two others.
You can access the Xprofiler reports from the Report menu. The Report menu lets you see the following reports:
Each report window includes a File menu. Under the File menu is the Save As option which allows you to save the report to a file. For information on using the Save File Dialog window to save a report to a file, see "Using the Save Dialog Windows".
Each report window also includes a Search Engine field, which is located at the bottom of the window. The Search Engine lets you search for a specific string in the report. For information on using the Search Engine field, see "Using the Search Engine".
| Note: | If you select the Save As option from the Flat Profile, Function Index, or Function Call Summary report windows, you must either complete the save operation or cancel it before you can select any other option from the menus of these reports. You can, however, use the other menus of Xprofiler before completing the save operation or canceling it, with the exception of the Load Files option, of the File menu, which remains greyed out. |
Each of the Xprofiler reports are explained below.
When you select the Flat Profile menu option, the Flat Profile window appears. The Flat Profile report shows you the total execution times and call counts for each function (including shared library calls) within your application. The entries for the functions that use the greatest percentage of the total CPU usage appear at the top of the list, while the remaining functions appear in descending order, based on the amount of time used.
Unless you specified the -z command line option, the Flat Profile report does not include functions whose CPU usage is 0 (zero) and have no call counts.
Note that the data presented in the Flat Profile window is the same data that is generated with the UNIX gprof command.
The Flat Profile report looks similar to this:
Figure 25. Flat Profile Report
 View figure.
The Flat Profile window fields are explained below.
The percentage of the program's total CPU usage that is consumed by this function.
A running sum of the number of seconds used by this function and those listed above it.
The number of seconds used by this function alone. The self seconds values are what Xprofiler uses to sort the functions of the Flat Profile report.
The number of times this function was called (if this function is profiled). Otherwise, it is blank.
The average number of milliseconds spent in this function per call (if this function is profiled). Otherwise, it is blank.
The average number of milliseconds spent in this function and its descendants per call (if this function is profiled). Otherwise, it is blank.
The name of the function. The index appears in brackets [] to the right of the function name. The index serves as the function's identifier within Xprofiler. It also appears below the corresponding function in the function call tree.
The Call Graph Profile menu option lets you view the functions of your application, sorted by the percentage of total CPU usage that each function, and its descendants, consumed. When you select this option, the Call Graph Profile window appears.
Unless you specified the -z command line option, the Call Graph Profile report does not include functions whose CPU usage is 0 (zero) and have no call counts.
Note that the data presented in the Call Graph Profile window is the same data that is generated with the UNIX gprof command.
The Call Graph Profile report looks similar to this:
Figure 26. Call Graph Profile Report
 View figure.
The fields of the Call Graph Profile are explained below.
The index of the function in the Call Graph Profile. Each function in the Call Graph Profile has an associated index number which serves as the function's identifier. The same index also appears with each function box label in the function call tree, as well as other Xprofiler reports.
The percentage of the program's total CPU usage that was consumed by this function and its descendants.
The number of seconds this function spends within itself.
The number of seconds spent in the descendants of this function, on behalf of this function.
The heading of this column refers to the three different kinds of calls that take place within your program. The values in this field correspond to the functions listed in the name, index, parents, children field to its right. Depending on whether the function is a parent, child, or the function of interest (the function who's index is listed in the index field of this row), this value can stand for one of the following:
In the example below, sub2 is the function of interest, sub1 and main are its parents, and printf and sub1 are its children.
Figure 27. called/total, call/self, called/total field
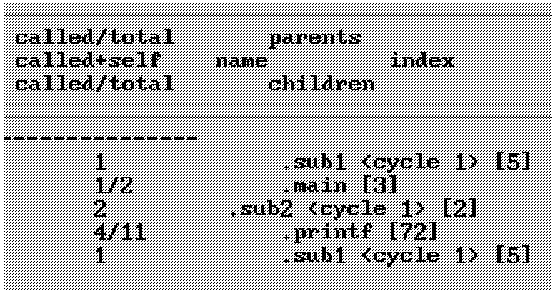 View figure.
For a parent function, this refers to the number of calls made to the function of interest, as well as the total number of calls it made to all functions. In the example above, one of the parent functions, main, made two calls; one to the function of interest, sub2, and one to another function.
This refers to the number of times the function of interest called itself, recursively. In the example above, the function of interest, sub2, called itself two times. For a child function, this refers to the number of times the function of interest called this child. In the example above, one of the child functions, printf, was called eleven times; four times by the function of interest, sub2, and seven times by other functions.
The layout of the heading of this column is indicative of the information that is provided. To the left is the name of the function, and to its right is the function's index number. Appearing above the function are its parents, and below are its children.
Figure 28. name/index/parents/children field
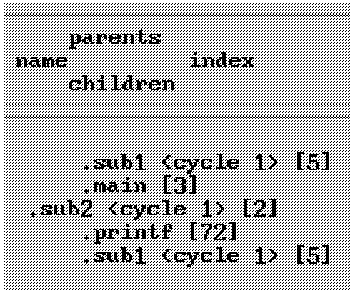 View figure.
The name of the function, with an indication of its membership in a cycle, if any. Note that the function of interest appears to the left, while its parent and child functions are indented above and below it. In the example above, the name of the function is sub2.
The index of the function in the Call Graph Profile. This number corresponds to the index that appears in the index column of the Call Graph Profile and the on the function box labels in the function call tree. In the example above, the index of sub2 is [2].
The parents of the function. A parent is any function that directly calls the function in which you are interested. In the example above, the parents are sub1 and main.
If any portion of your application was not compiled with the -pg option, Xprofiler will not be able to identify the parents for the functions within those portions. As a result, these parents will be listed as spontaneous in the Call Graph Profile report.
The children of the function. A child is any function that is directly called by the function in which you are interested. In the example above, the children are printf and sub1.
The Function Index menu option lets you view a list of the function names included in the function call tree. When you select this option, the Function Index window appears, and displays the function names in alphabetical order. To the left of each function name is its index, enclosed in brackets []. The index is the function's identifier, which is assigned by Xprofiler. An index also appears on the label of each corresponding function box in the function call tree as well as other reports.
Unless you specified the -z command line option, the Function Index report does not include functions whose CPU usage is 0 (zero) and have no call counts.
The Function Index menu option includes a Code Display menu, like the Flat Profile menu option, allowing you to view source code or disassembler code. For more information on viewing code, see "Viewing Source Code" and "Viewing Disassembler Code".
The Function Index report looks similar to this:
Figure 29. Sample Function Index Report
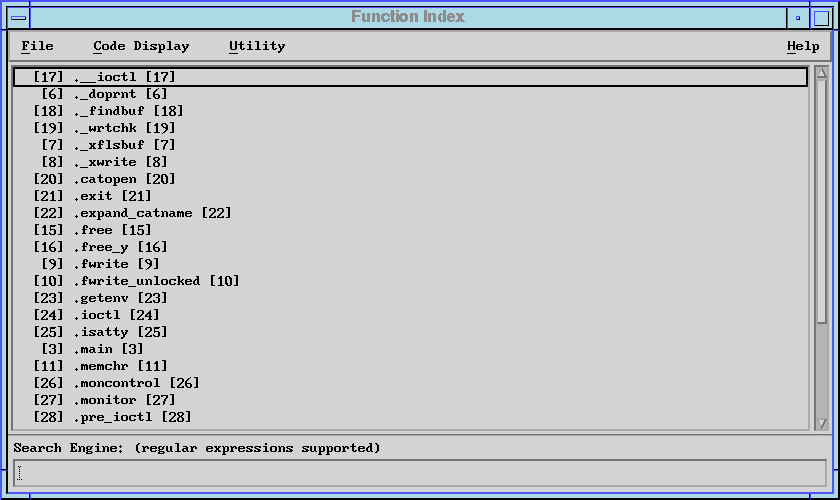 View figure.
The Function Call Summary menu option lets you display all the functions in your application that call other functions. They appear as caller-callee pairs (call arcs, in the function call tree), and are sorted by the number of calls in descending order. When you select this option, the Function Call Summary window appears.
The Function Call Summary report looks similar to this:
Figure 30. Sample Function Call Summary Report
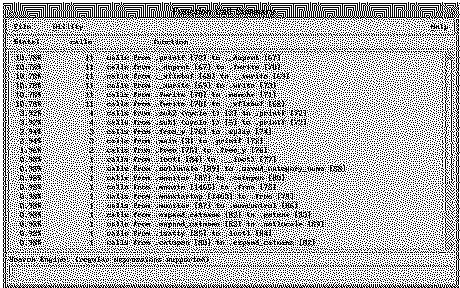 View figure.
The fields of the Function Call Summary window are explained below.
The percentage of the total number of calls generated by this caller-callee pair.
The number of calls attributed to this caller-callee pair.
The name of the caller function and callee function.
The Library Statistics menu option lets you display the CPU time consumed and call counts of each library within your application. When you select this option, the Library Statistics window appears.
The Library Statistics report looks similar to this:
Figure 31. Sample Library Statistics Report
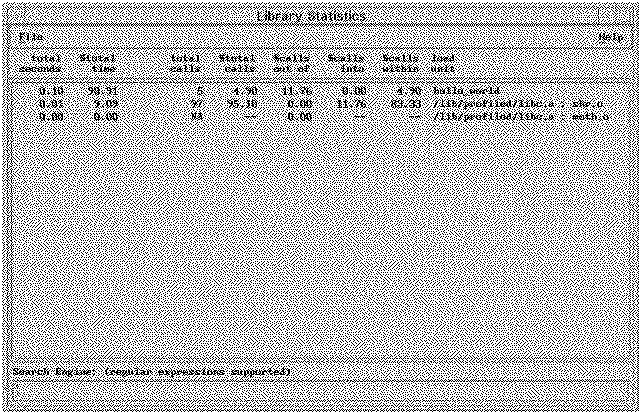 View figure.
The fields of the Library Statistics window are explained below.
The total CPU usage of the library, in seconds.
The percentage of the total CPU usage that was consumed by this library.
Total number of calls generated by this library.
The percentage of the total calls that were generated by this library.
The percentage of the total number of calls made from this library to other libraries.
The percentage of the total number of calls made from other libraries into this library.
The percentage of the total number of calls made between the functions within this library.
The library's full path name.
Xprofiler lets you save any of the reports you generate with the Report menu to a file. You can do this via the File and Report menus of the Xprofiler GUI.
To save a single report, go to the Report menu, on the Xprofiler main window, and select the report you would like to save. Each report window includes a File menu. Select the File menu and then the Save As option to save the report. A Save dialog window appears, which is named according to the report from which you selected the Save As option. For instance, if you chose Save As from the Flat Profile window, the dialog window is named Save Flat Profile Dialog.
You can save the Call Graph Profile, Function Index, and Flat Profile reports to a single file with the the File menu of the Xprofiler main window. The information you generate here is identical to the output of the UNIX gprof command. From the File menu, select the Save As option. The Save File Dialog window appears.
To save the report(s):
| Note: | Once you select the Save As option from the File menu, and the Save Profile Reports window opens, you must either complete the save operation or cancel it before you can select any other option from the menus of its parent window. For example, if you select the Save As option from the Flat Profile report, and the Save File Dialog window appears, you cannot use any other option of the Flat Profile report window. |
The File Selection field of the Save File Dialog window follows Motif standards.
If you are profiling a parallel program, you could specify more than one profile data (gmon.out) file when you started Xprofiler. The Save gmon.sum As option of the File menu lets you save a summary of the data in each of these files to a single file.
The Xprofiler Save gmon.sum As option produces the same result as the Xprofiler and gprof -s command line option. If you run Xprofiler later, you can use the file you create here as input with the -s option. In this way, you can accumulate summary data over several runs of your application.
To create a summary file:
The Save Configuration menu option lets you save the names of the functions that are displayed currently to a file. Later, in the same Xprofiler session or a different session, you can read in this configuration file using the Load Configuration option. See the following section, "Loading a Configuration File", for more information.
To save a configuration file:
You can use the default file name, enter a file name in the Selection field, or select a file from the dialog's files list.
If you select the Forced File Overwriting option in the Runtime Options Dialog window, the Overwrite File Dialog does not open and the specified file is overwritten without warning.
The Load Configuration menu option lets you read in a configuration file that you saved. See the previous section, "Saving a Configuration File", for more information. The Load Configuration option automatically reconstructs the function call tree according to the function names recorded in the configuration file.
To load a configuration file:
You can also load the file with the -c command line option. See "Specifying Command Line Options (from the GUI)" for more information.
If the a.out name, that is, the program name in the configuration file, is different from the a.out name in the current display, a confirmation dialog appears to allow you to decide whether or not you still wish to load the file.
Xprofiler provides several ways for you to view your source code. You can view the source or disassembler code for your application on a per-function basis. This also applies to any included function code your application may use.
When you view source or included function code, you use the Source Code window. When you view disassembler code, you use the Disassembler Code window. You can access these windows through the Report menu of the Xprofiler GUI or the Function menu of the function in which you are interested.
Both the Function menu and Report menu provide the means for you to access the Source Code window, from which you will view your code.
To access the Source Code window via the Function menu:
To access the Source Code window via the Report menu:
The Source Code window shows you only the source code file for the function you specified from the Flat Profile window or the Function menu. The Source Code Window looks similar to this:
Figure 32. Sample Source Code Window
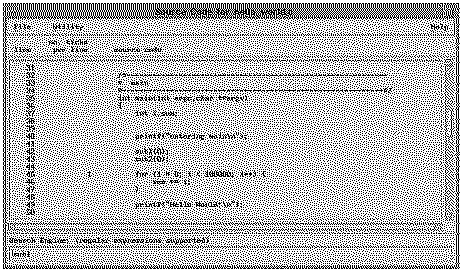 View figure.
The Source Code Window contains information in the following fields:
The source code line number.
Each tick represents .01 seconds of CPU time used. The number that appears in this field represents the number of ticks used by the corresponding line of code. For instance, if the number 3 appeared in this field, for a source statement, this source statement would have used .03 seconds of CPU time. Note that the CPU usage data only appears in this field if you used the -g option when you compiled your application. Otherwise, this field is blank.
The application's source code.
The Search Engine field, at the bottom of the Source Code window, lets you search for a specific string in your source code. For information on using the Search Engine field, see "Using the Search Engine"
The Source Code window contains the following menus:
The Save As option lets you save the annotated source code to a file. When you select this option, the Save File Dialog window appears. For more information on using the Save File Dialog window, see "Using the Save Dialog Windows"
Select Close if you wish to close the Source Code window.
The Utility menu contains only one option; Show Included Functions.
For C++ users, the Show Included Functions option lets you view the source code of included function files that are included by the application's source code.
If a selected function does not have an included function file associated with it or does not have the function file information available because the -g option was not used for compiling, the Utility menu will be greyed out. The availability of the Utility menu serves as an indication of whether or not there is any included function file information associated with the selected function.
When you select the Show Included Functions option, the Included Functions Dialog window appears, which lists all of the included function files. Specify a file by either clicking on one of the entries in the list with the left mouse button, or by typing the the file name in the Selection field. Then click on the OK or Apply button. After selecting a file from the Included Functions Dialog window, the Included Function File window appears, displaying the source code for the file that you specified.
Both the Function menu and Report menu provide the means for you to access the Disassembler Code window, from which you can view your code.
To access the Disassembler Code window via the Function menu:
To access the Disassembler Code window via the Report menu:
The Disassembler Code window shows you only the disassembler code for the function you specified from the Flat Profile window. The Disassembler Code Window looks similar to this:
Figure 33. Sample Disassembler Code Window
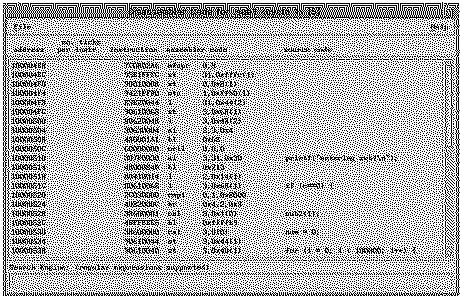 View figure.
The Disassembler Code window contains information in the following fields:
The address of each instruction in the function you selected (from either the Flat Profile window or the function call tree).
Each tick represents .01 seconds of CPU time used. The number that appears in this field represents the number of ticks used by the corresponding instruction. For instance, if the number 3 appeared in this field, this instruction would have used .03 seconds of CPU time.
The execution instruction.
The execution instruction's corresponding assembler code.
The line in your application's source code that corresponds to the execution instruction and assembler code. In order for information to appear in this field, you must have compiled your application with the -g compile option.
The Search Engine field, at the bottom of the Disassembler Code window, lets you search for a specific string in your disassembler code. For information on using the Search Engine field, see "Using the Search Engine".
The Disassembler Code window contains only one menu:
Select Save As to save the annotated disassembler code to a file. When you select this option, the Save File Dialog window appears. For information on using the Save File Dialog window, see "Using the Save Dialog Windows".
Select Close if you wish to close the Disassembler window.
The File menu of the Xprofiler GUI includes an option called Screen Dump that lets you capture an image of the Xprofiler main window. This option is useful if you want to save a copy of the graphical display to refer to later. You can either save the image as a file in PostScript format, or send it directly to a printer.
To capture a window image:
Figure 34. Screen Dump Options Dialog Window
View figure.
This option lets you specify whether you want to save the captured image as a PostScript file or send it directly to a printer.
If you would like to save the image to a file, select the File button. This file, by default, is named Xprofiler.screenDump.ps.0, and is displayed in the Default File Name field of this dialog window. When you select the File button, the text in the Print Command field greys out.
If you would like to send the image directly to a printer, select the Printer button. The image is sent to the printer you specify in the Print Command field of this dialog window. Note that when you specify the Print option, a file of the image is not saved. Also, selecting this option causes the text in the Default File Name field to grey out.
This option lets you specify whether you want to capture the image in shades of grey or in color.
If you want to capture the image in shades of grey, select the GreyShades button. You must also select the number of shades you want the image to include with the Number of Grey Shades option, as discussed below.
If you want to capture the image in color, select the Color button. GreyShades.
This option lets you specify the number of grey shades that the captured image will include. Select either the 2, 4, or 16 buttons, depending on the number of shades you want to use. Typically, the more shades you use, the longer it will take to print the image. 16.
This option lets you specify how long of a delay will occur between activating the capturing mechanism and when the image is actually captured. By default, the delay is set to one second, but you may need time to arrange the window the way you want it. Setting the delay to a longer interval gives you some extra time to do this. You set the delay with the slider bar of this field. The number above the slider indicates the time interval in seconds. You can set the delay to a maximum of thirty seconds.
To set the delay, place the mouse cursor over the slider. Next, press and hold the left mouse button while moving the slider to the right. When the slider is at the desired number, release the mouse button.
This option lets you specify that you want the output to be in landscape format (the default is portrait). To select landscape format, select the Enable Landscape button.
This option lets you specify that you would like information about how the file was created to be included in the PostScript image file. By default, this information is not included. To do this, select the Annotate Output button.
If you chose to put your output in a file, this field lets you specify the file name. The default file name is Xprofiler.screenDump.ps.0. If you want to change to a different file name, type it over the one that appears in this field.
If you specify the output file name with an integer suffix (that is, the file name ends with xxx.nn, where nn is a non-negative integer), the suffix automatically increases by one every time a new output file is written in the same Xprofiler session.
If you chose to send the captured image directly to a printer, this field lets you specify the print command. The default print command is qprt -B ga -c -Pps. If you would like to use a different command, type the new command over the one that appears in this field.
Once you have set your screen dump options, you need to select the window, or portion of a window, you wish to capture. From the Screen Dump menu, select the Select Target Window option. A cursor in the image of a hand appears after the number of seconds you specified. At any time you wish to cancel the capture, you may do so by clicking on the right mouse button. The hand-shaped cursor will change back to normal and the operation will be terminated.
To capture the entire Xprofiler window, place the cursor in the window and then click the left mouse button.
To capture a portion of the Xprofiler window:
If you chose to save the image as a file, the file is stored in the directory you specified. If you chose to print the image, the image is sent to the printer you specified.